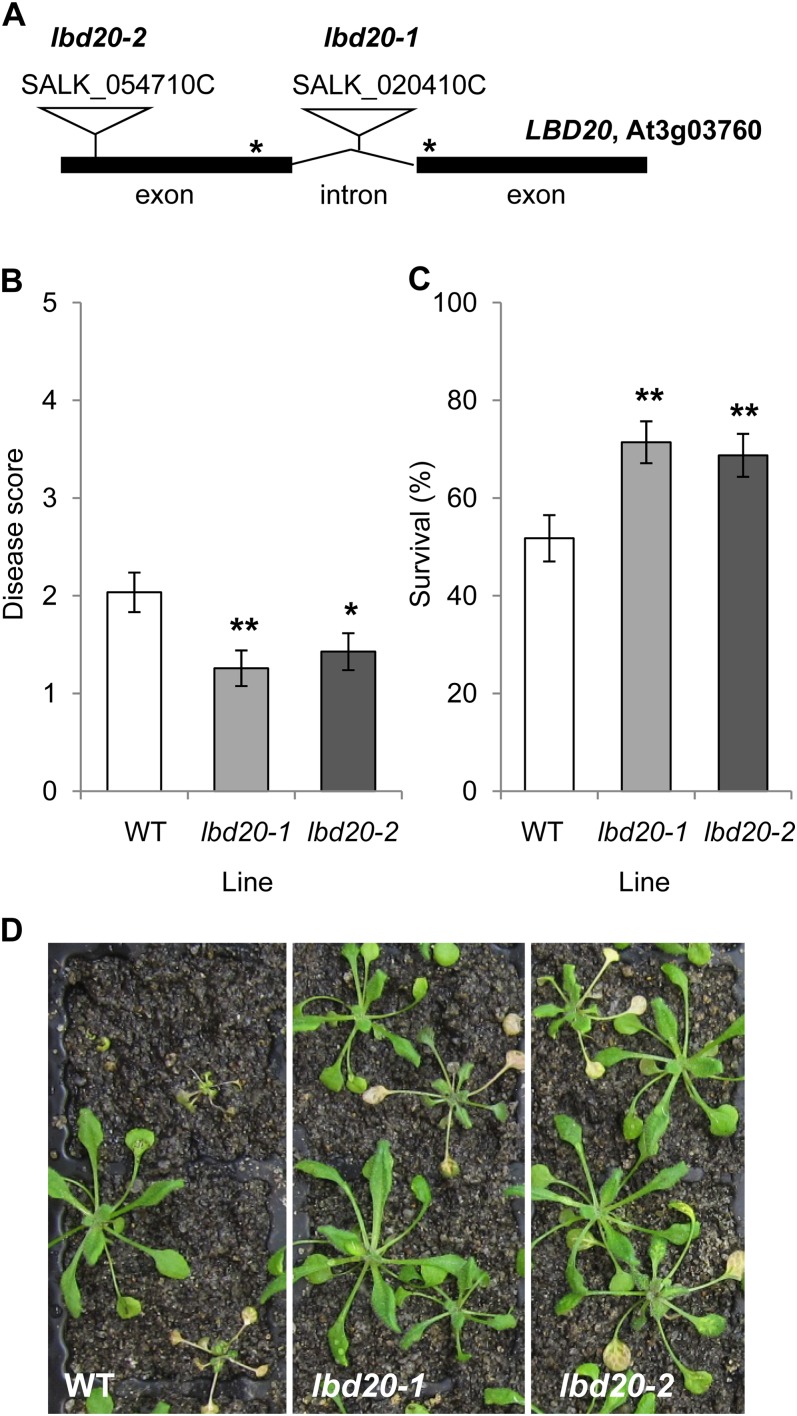
Figure 1.
Two independent lbd20 T-DNA mutant lines exhibit increased resistance to F. oxysporum. A, Schematic representation of lbd20-1 and lbd20-2 T-DNA insertion lines. Not drawn to scale. Primer binding sites for determination of LBD20 expression are noted with asterisks. B to d, Disease phenotypes of F. oxysporum inoculated plants with disease score at 14 d post inoculation (B), survival at 21 d post inoculation (C), and representative images of plants 14 d post inoculation (D). The average of three biological replicates consisting of 14 plants each is shown with se. Asterisks indicate values that are significantly different (**P < 0.01, *P < 0.05 Student’s t test) from the wild type (WT).

