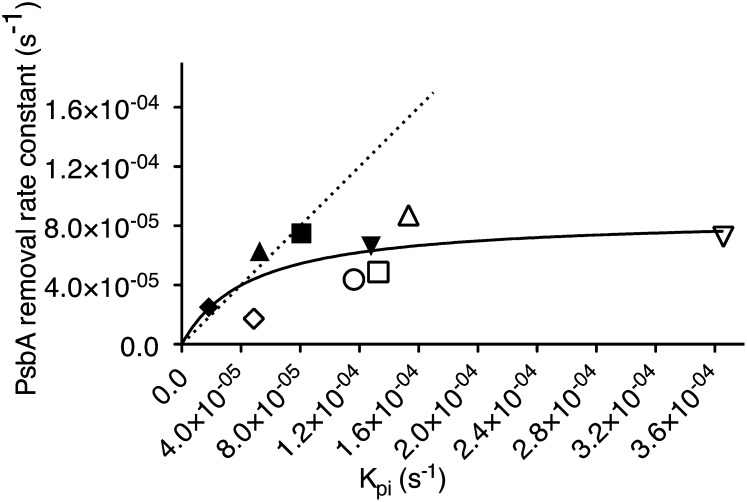
Figure 4.
Correlation of PsbA removal rate constant (s−1) and photoinactivation rate constant of PSII (kπ, s−1) in T. pseudonana cells grown at 30 μmol photons m−2 s−1, 12°C (open circle), 18°C (open upward triangle, diamond, downward triangle), or 24°C (open square) and C. radiatus cells grown at 18°C (closed upward triangle, diamond, downward triangle) or 24°C (closed square). Rate constants were estimated from samples taken during 90 min of exposure to 450 μmol photons m−2 s−1 blue light (circles, upward triangles, squares) or 450 μmol photons m−2 s−1 red light (diamonds), or 1,400 μmol photons m−2 s−1 white fluorescent light (downward triangles). n = 3 to 5, ±se for both x and y axes. Dotted line indicates 1:1 ratio; solid line shows a hyperbolic tangent Michaelis-Menten curve fit to the data, showing saturation of the PsbA removal rate constant.

