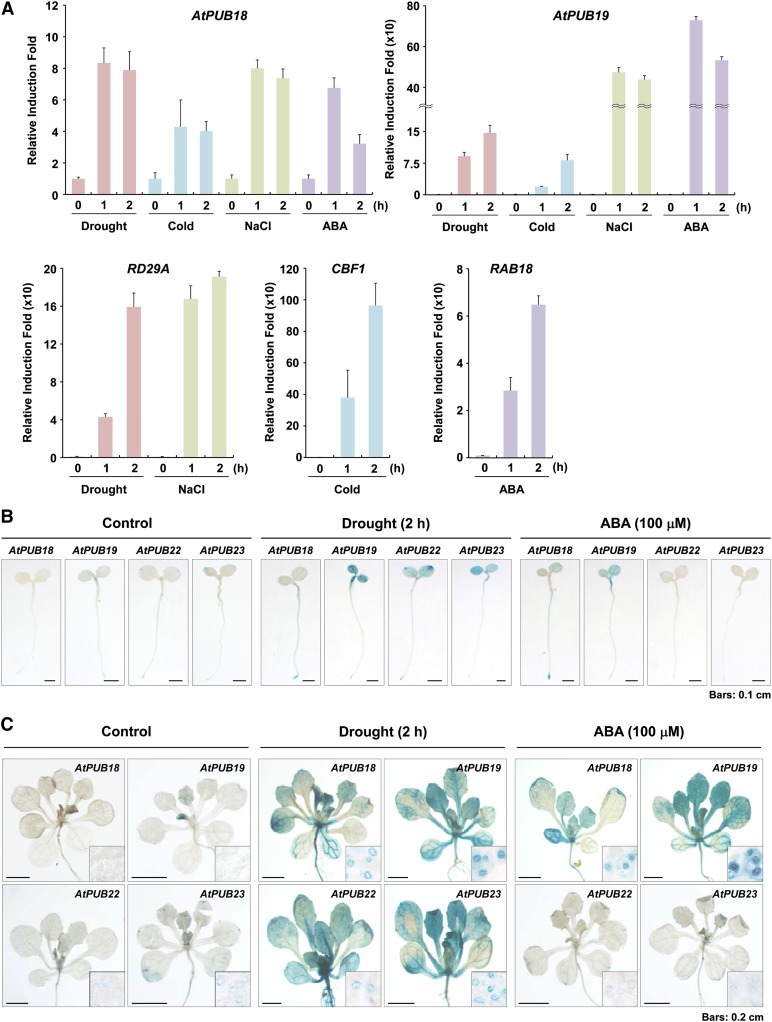
Figure 1.
Induction patterns of AtPUB18, AtPUB19, AtPUB22, and AtPUB23 in response to ABA and abiotic stresses, as determined by real-time qRT-PCR and histochemical GUS assays. A, Light-grown, 10-d-old Arabidopsis seedlings were treated with drought, cold, high salinity, and ABA. Total RNA was extracted from the stress-treated whole seedlings and used for qRT-PCR. RD29A, CBF1, and RAB18 were positive controls for drought and high salt, cold, and ABA treatments, respectively. To calculate the relative expression levels of each gene, glyceraldehyde-3-phosphate dehydrogenase C subunit was used as an internal reference gene. Error bars represent sd from three independent experiments. B and C, Promoter (1.0-kb upstream region) activities of AtPUB18, AtPUB19, AtPUB22, and AtPUB23 in response to ABA (100 μm) and dehydration (2 h). B, Histochemical GUS expression patterns in 5-d-old T3 promoter:GUS transgenic seedlings. Bars = 0.1 cm. C, GUS activities in aerial parts and guard cells of 2-week-old transgenic plants. Bars = 0.2 cm. [See online article for color version of this figure.]

