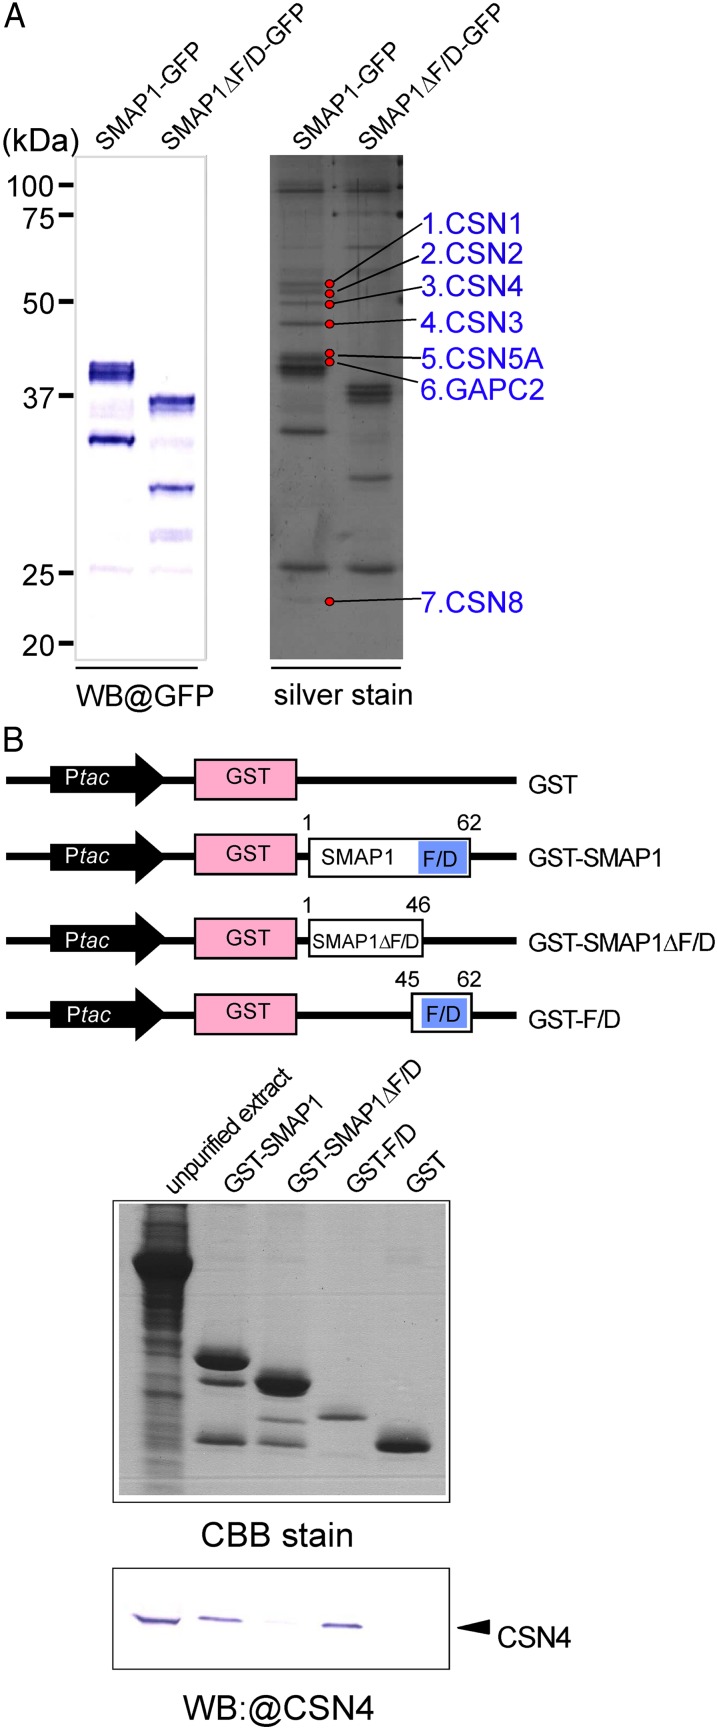
Figure 5.
Physical interaction between SMAP1 and CSN. A, In vivo pull-down assay using GFP-tagged proteins in aar1-1 transgenic plants. Two transgenic lines, SMAP1-GFP/aar1-1 and SMAP1ΔF/D-GFP/aar1-1, were used in pull-down assays. Pulled down proteins were separated by SDS-PAGE and detected by western blotting (WB) using anti-GFP or by silver staining. Seven protein bands (marked by red circles) that bind to SMAP1-GFP but not to SMAP1ΔF/D-GFP were eluted and identified by LC-MS/MS (Table I). B, In vitro pull-down assay using GST-tagged protein constructs. The top panel shows a schematic diagram of constructs of GST-tagged proteins; GST control, GST-tagged full-length SMAP1 (GST-SMAP1), F/D region-deleted version of SMAP1 (GST-SMAP1ΔF/D), and the F/D region only (GST-F/D). SMAP1 and GST coding regions are shown as white and pink boxes, respectively. Blue boxes indicate the F/D-rich region in SMAP1. Black arrows show the Ptac promoter for expression of the fusion protein in E. coli. The bottom panel shows unpurified total proteins from an aar1-1 plant (left lane) and eluted proteins from glutathione columns (other lanes) separated by SDS-PAGE and detected by Coomassie blue (CBB) or western blot with anti-CSN4 antibody. [See online article for color version of this figure.]

