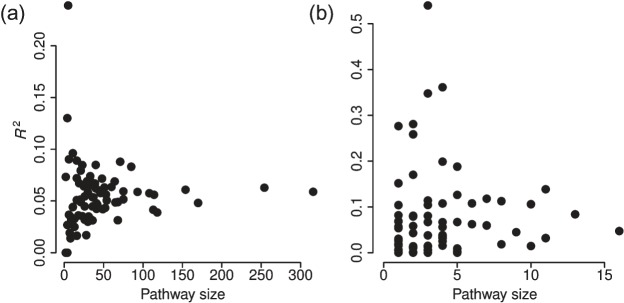
Fig. 1.
Overall R2 scores for pathway activation versus pathway size for each of the 80 included pathways estimated using the linear model in the gene (a) and metabolite (b) models on the original NCI-60 data. The limited availability of detailed metabolite data is clearly illustrated, as many of the pathways only contain one or two mapped metabolites. Each dot represents an average of the R2-values from 100 replicated runs.

