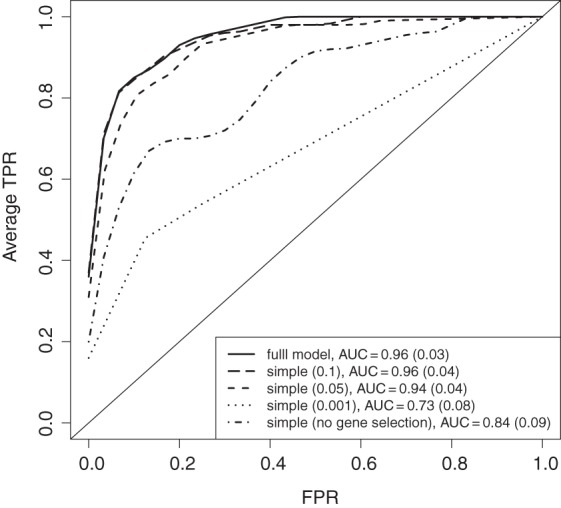
Fig. 3.

Results from the simulation study investigating different versions of the pathway model framework. The simple version is based on ranking with the moderated t-statistic (cutoffs used are 0.1, 0.05, 0.001, and 1) for genes and selection using elasticnet for metabolites (no rate-distortion). The different ROC curves are the average from 10 simulated data sets. In each simulated set, 10 repeats of the estimation were run to assess the cross-validation variability. Error bars have been excluded for easier visualization. The average AUC is given with associated standard deviation.
