
Figure 4.
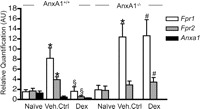
Profile of AnxA1, FPR1 and FPR2 gene product expression in ankle joints of AnxA1+/+ and AnxA1−/− mice treated with dexamethasone (Dex). AnxA1+/+ and AnxA1−/− mice were given an intraperitoneal injection of K/BxN serum (50 μl at day 0 and day 2) and then received vehicle or Dex (10 µg intraperitoneally daily). Quantitative real-time PCR was performed on cDNA from left ankle joints of mice from each experimental group (day 10). The AnxA1, FPR1 and FPR2 genes were analysed with all Ct values normalised to endogenous Gapdh (four mice per group). Naive joints were set as the calibrator samples. Mean RQ values±SE shown here were calculated using 2−(ΔΔCt) method. *p<0.05 versus naive; §p<0.05 versus appropriate vehicle control; #p<0.05 versus AnxA1+/+ group (Student t test).