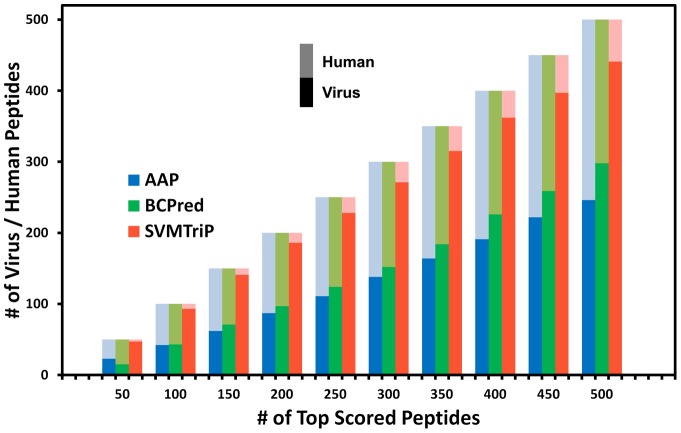
Figure 2. Tendency test for BCPred, AAP, and SVMTriP.
Three bars at the same point on the x-axis are the results for APP (blue), BCPred (green), and SVMTriP (red), respectively. In the same bar, the light part is for the number of returned human peptide, and the dark part is for virus. For example, at the point of 400 returned peptides, the dark part in the red bar is 362, which means that 362 viral peptides are return in all 400 peptides by SVMTriP, and the light red part represents 38 human peptides.

