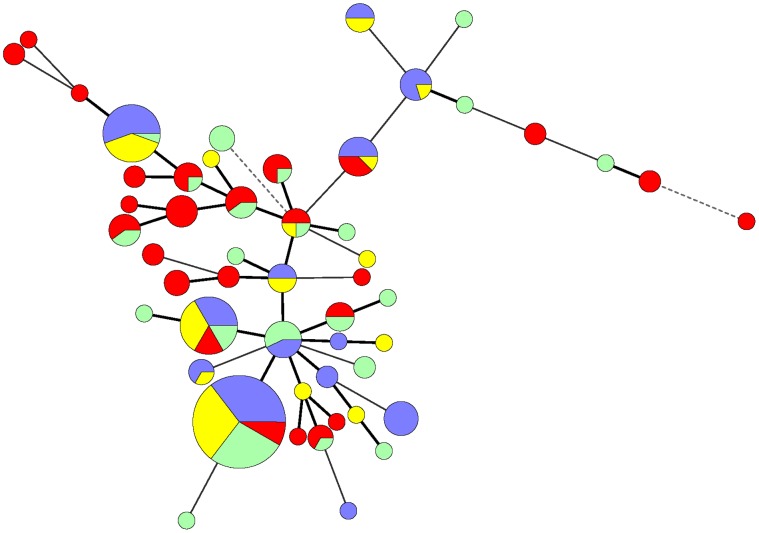
Figure 2. Minimum spanning tree (MST) of C. coli isolates from ABF and conventional production systems.
Each ST is represented by a node. The size of each node is proportional to the number of strains that comprise that ST. Pie charts with differential colors represent C. coli sources: ABF pigs and carcass (purple), ABF environment at farm and slaughter (yellow), conventional pigs and carcass (red), and conventional environment at farm and slaughter (green). Allele differences are represented by thick bold branch lines (single locus variants), thin continuous lines (double locus variants), and dashed lines (three allele differences). Unique STs of the pigs, carcass, and environment at farm and slaughter from ABF and conventional systems were distinguished by single colored nodes.

