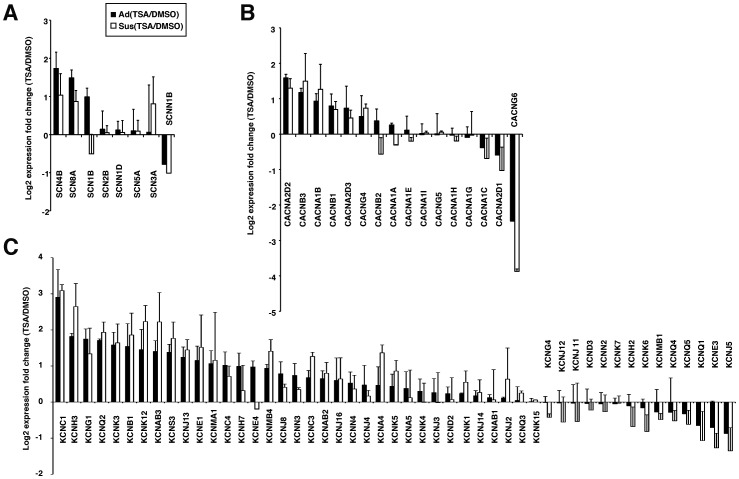
Figure 2. Microarray data for the expression of genes involved in cardiac ion channel function.
Global gene expression analyses were conducted using TSA- or DMSO-treated hESC-CMs under the Ad culture conditions (black bar) or Sus culture conditions (white bar). Genes involved in (A) sodium, (B) calcium and (C) potassium ion channels were analyzed. Each graph displays the mean and SD of two or three independent experiments.

