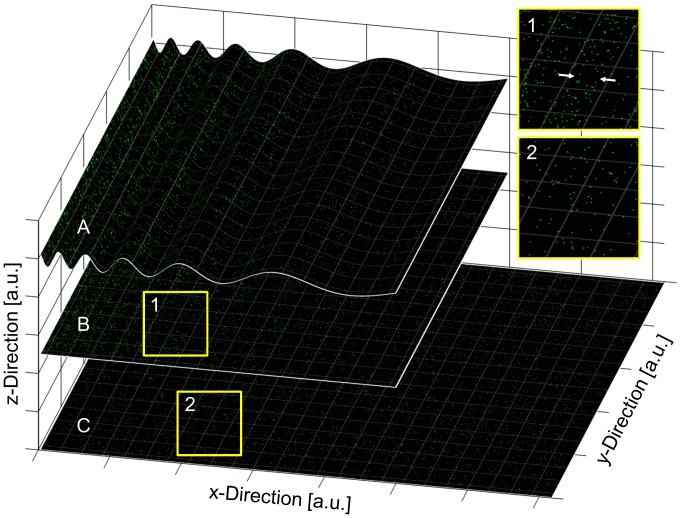
Figure 1. Simulated cell curvature effects on projected random molecule distributions.
A: Random molecule distribution on a chirp curvature in x-direction. B: Projection of the curved random distribution along the z-direction. C: Non-curved random molecule distribution (same as in A). Molecule aggregations along the x-direction are induced by the projection of the curved random distribution (highlighted by two arrows in section 1). These aggregations are not present in the non-curved random distribution (section 2). In a real SPDM measurement the projection is caused by a non-improved z-resolution.

