
Figure 5. Simulation results of random and cluster molecule distributions on cell curvatures.
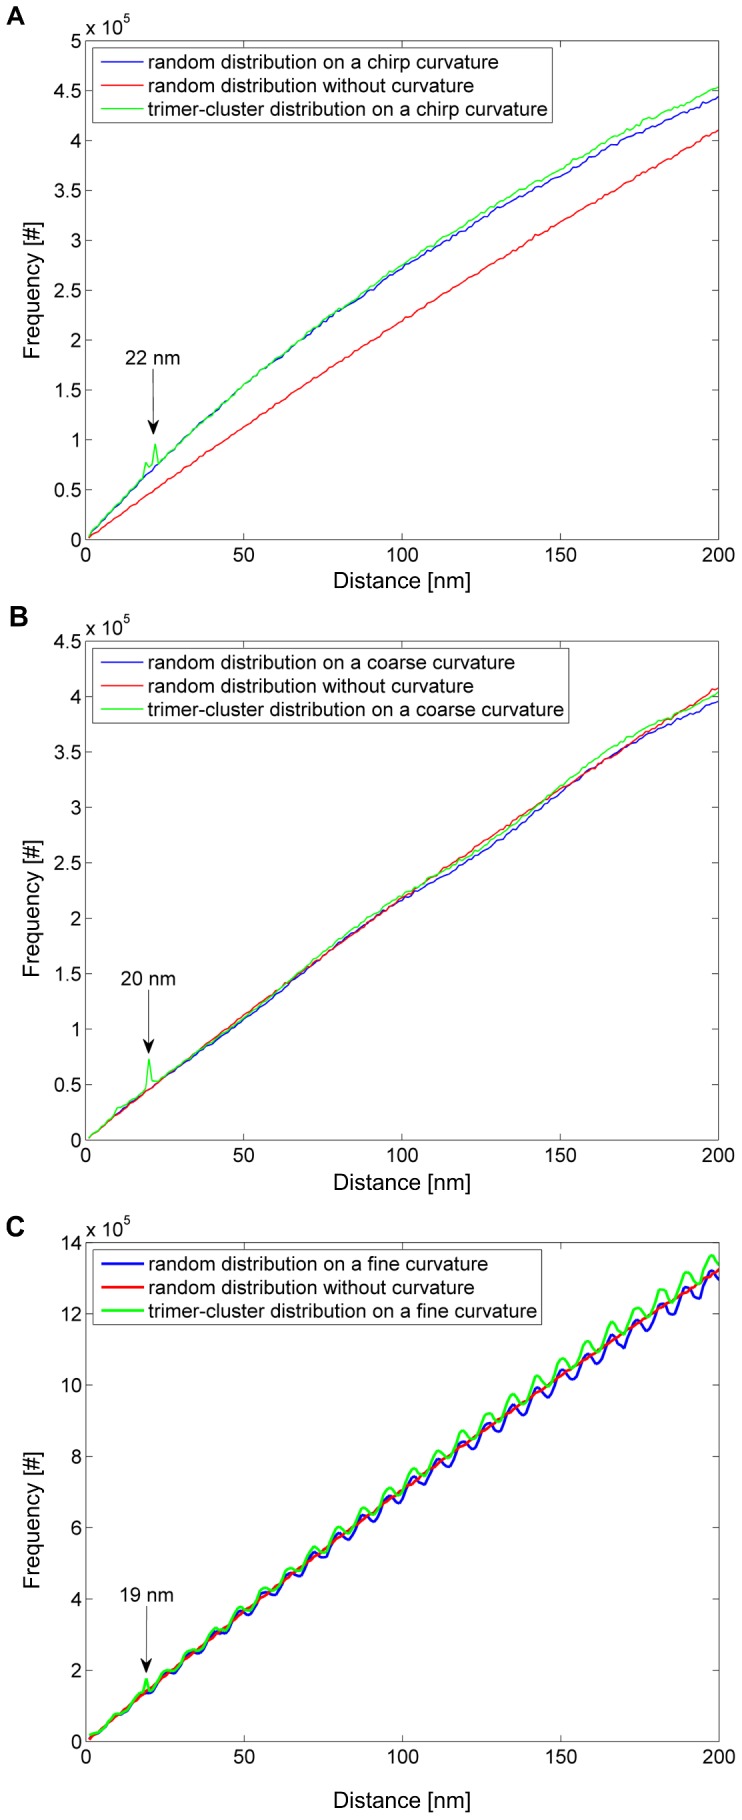
Spatial distribution analysis of random (blue) and trimer-cluster (green) molecule distributions on A: a chirp curvature, B: a coarse sinusoidal, and C: a fine sinusoidal curvature in x-direction projected along the z-direction (cf. Fig. 2 B). For control, a spatial distribution analysis of a random distribution without a curvature (red) is present in each plot. Only in A and B, the molecule clusters can be detected (highlighted by arrows with peak positions); whereas in C the detection of clusters is no longer possible since the peak at 19 nm cannot be separated from the peak resulting from cell curvature.