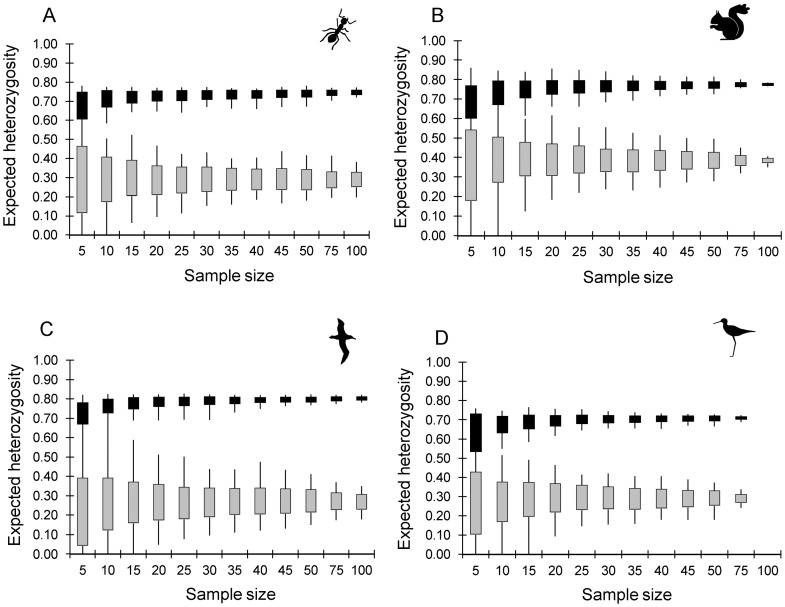
Figure 4. Impact of sample size on the accuracy and precision of sample heterozygosity.
The range (lines) and mean ± one standard deviation (solid boxes) of expected heterozygosity (HE) for the 100 random replicates at each sample size for a locus with high and a locus with low expected heterozygosity in the empirical dataset for A) the ant dataset, B) the squirrel dataset, C) the albatross dataset and D) the kakī dataset. Loci are: A) locus FE37 (real HE = 0.75, black boxes) and locus FE17 (real HE = 0.29, grey boxes); B) locus Scv3 (real HE = 0.78, black boxes) and locus Scv23 (real HE = 0.39, grey boxes); C) locus De11 (real HE = 0.807, black boxes) and locus D5 (real HE = 0.268, grey boxes); and D) locus Kakī_21 (real HE = 0.712, black boxes) and locus Kakī_40 (real HE = 0.291, grey boxes).

