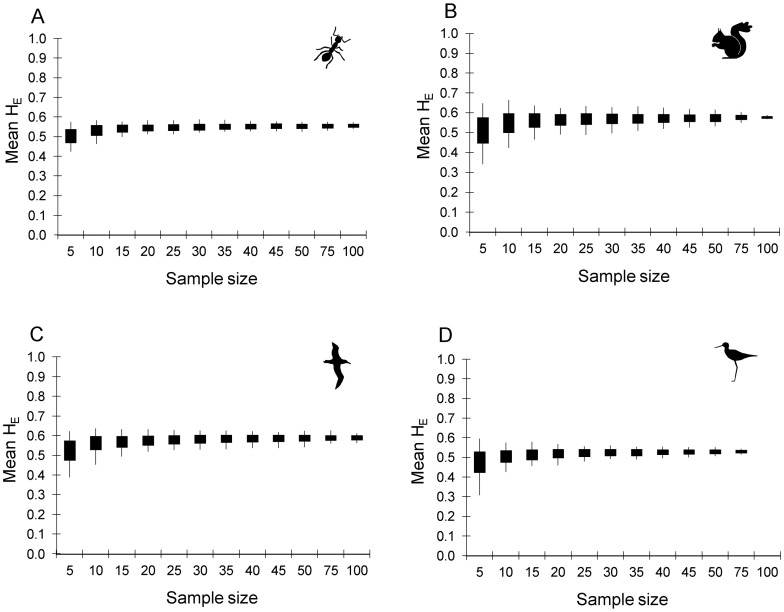
Figure 5. Impact of sample size on the accuracy and precision of mean heterozygosity across loci.
The range (lines) and mean ± one standard deviation (solid boxes) of mean expected heterozygosity (HE) for the 100 random replicates at each sample size for A) the ant dataset (9 loci), B) the squirrel dataset (5 loci), C) the albatross dataset (7 loci) and D) the kakī dataset (8 loci).

