
Figure 3. TTR spheroid oligomers and protofibrils.
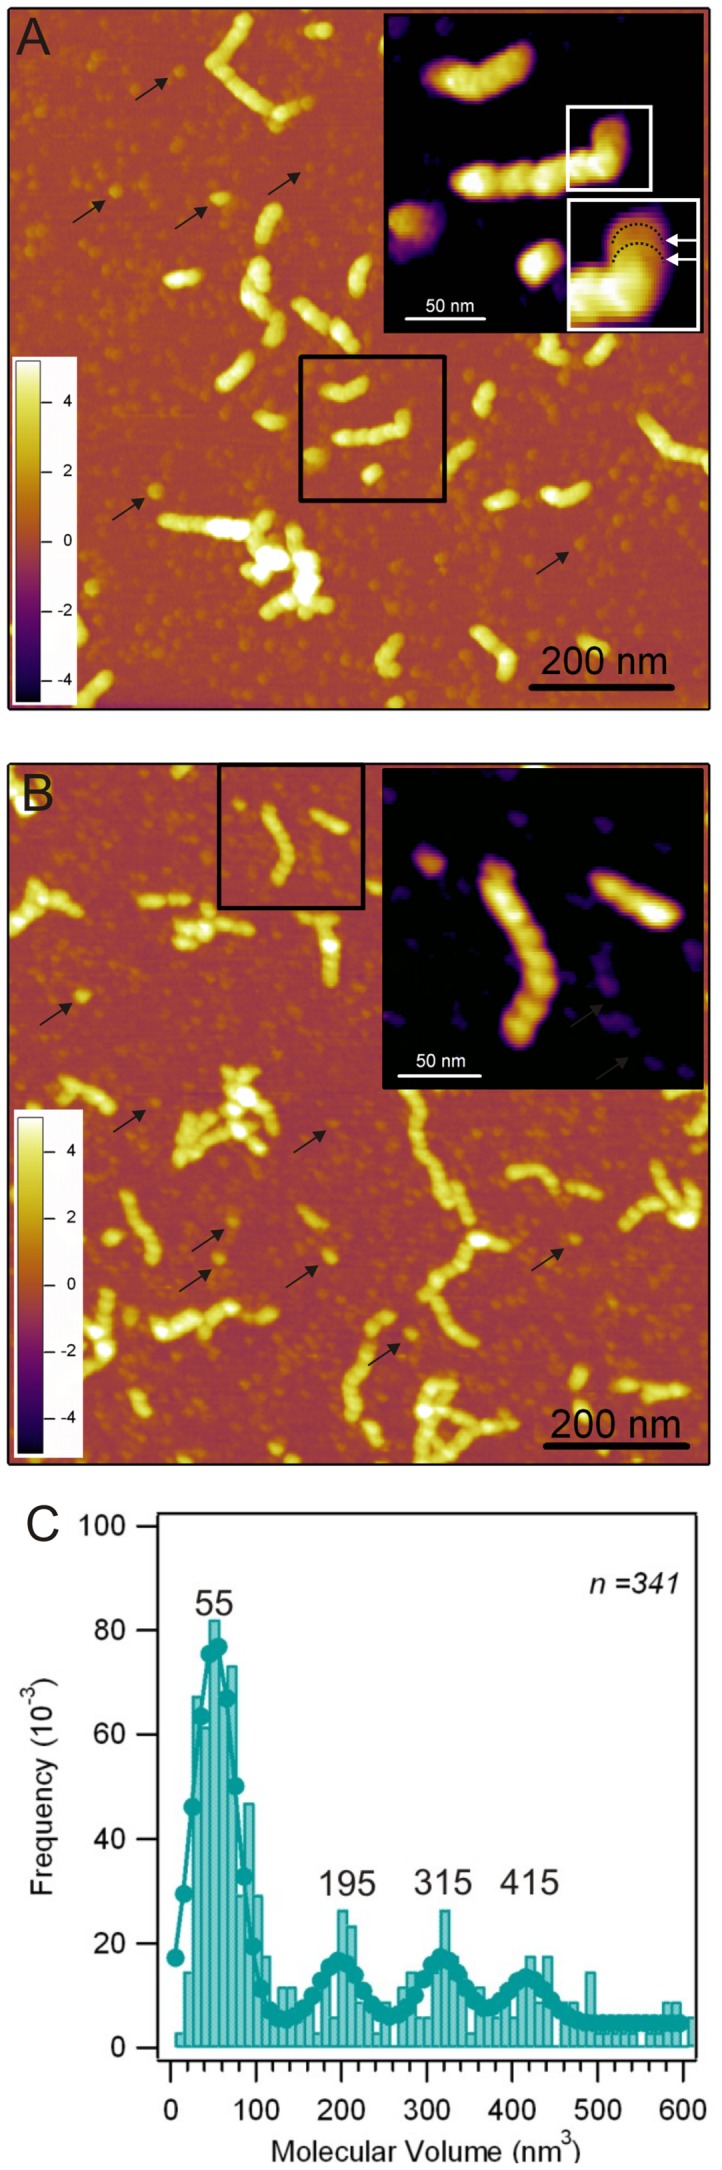
A. 1×1 µm2 AFM height contrast image of a mixed population of spheroid oligomers and short protofibrils. Black arrows point out examples of spheroid oligomers with various shapes and sizes. Inset, magnified view of a protofibril displaying a stack-like arrangement of flat, disc-shaped oligomers reminiscent of annular origin. B. 1×1 µm2 AFM height contrast image of a mixed population of spheroid oligomers and longer protofibrils. Black arrows point out examples of spheroid oligomers with various shapes and sizes. Inset, magnified view of a protofibril in which the underlying periodic structure is probably helical. C. Topographical molecular volume histogram of 341 (n) spheroid TTR oligomers. The numbers above the modes correspond to the mean values of gaussian fits.