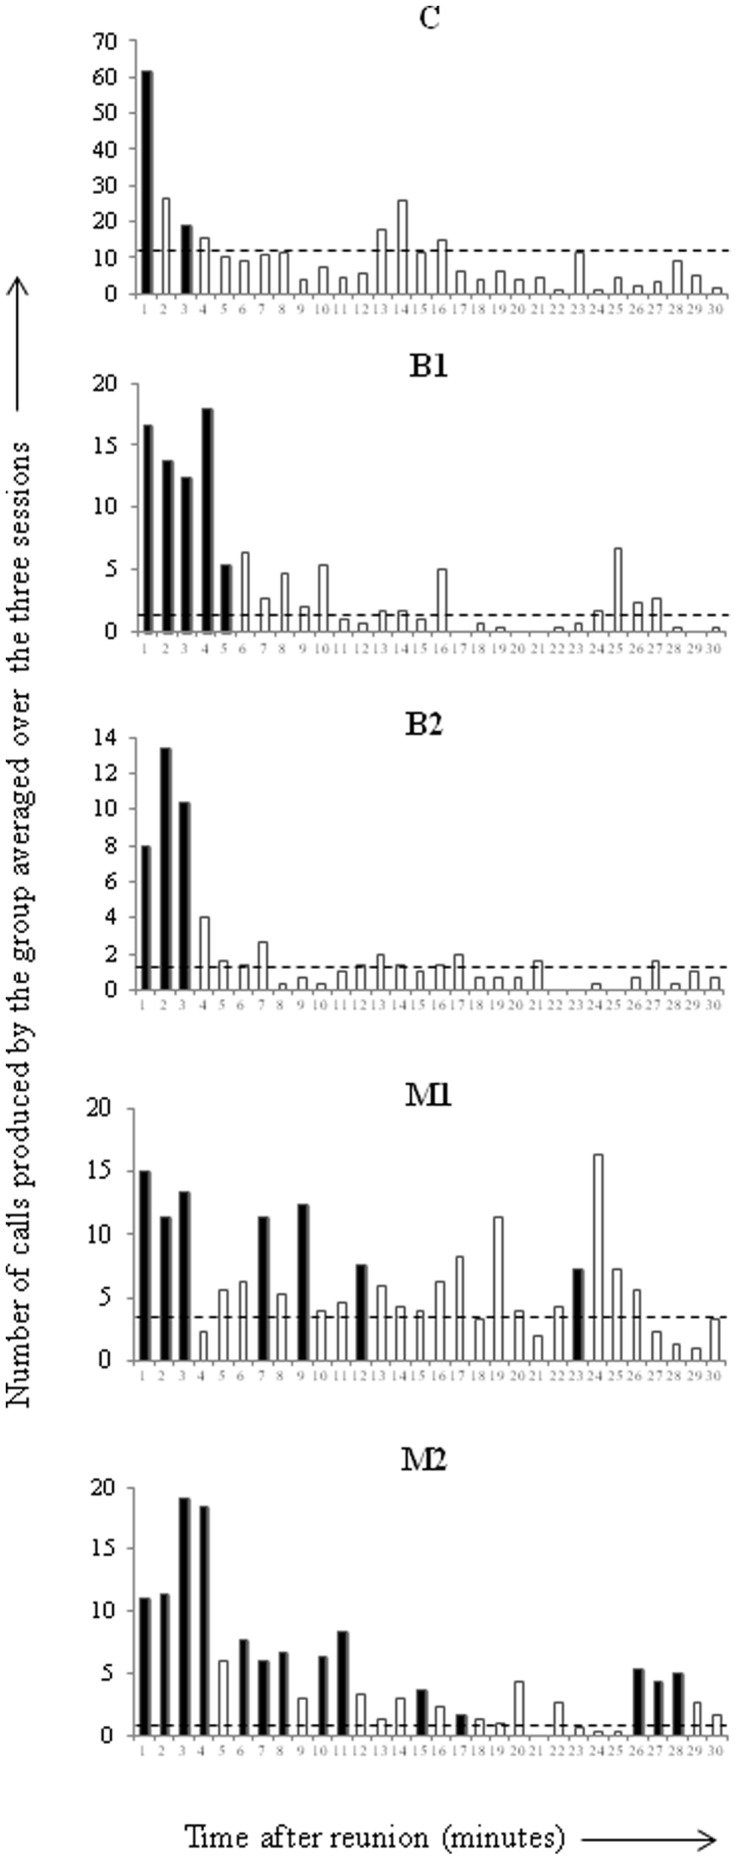
Figure 1. Post-reunion minute by minute temporal evolution of the mean number of calls (all call types and callers combined) emitted by each group (C, B1, B2, M1, M2) in the High affect intensity condition.

Black bars represent minutes for which the number of vocalizations was significantly higher than the number of calls in the Low affect intensity condition (Mann-Whitney tests, p<0.05). Dotted lines represent mean call rates in each group in the Low affect intensity condition.
