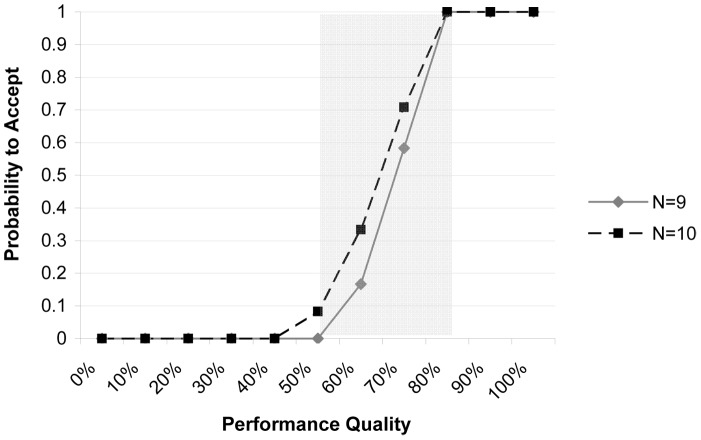
Figure 1. Operating Characteristic Curve for health facility assessments in Jigawa, Nigeria.
Operating Characteristic Curve for health facility assessments with sample size n = 7 and a decision rule of d = 5 for the upper cut-off PU = 80% and the lower cut-off PL = 50% for Senatorial Districts with a total of N = 9 and 10 health facilities. The area in between the upper and lower cut-off is the “grey area”. Changing d would shift the curve to the left or right; increasing the sample size would result in a sharper gradient of the curve and a smaller grey area. However, no matter how large the sample size there will always be a grey area and a certain level of misclassification error. We selected n and d to reduce the two forms of misclassification errors; it was ensured that the alpha error or the probability of mistakenly failing to accept an SD with acceptable performance (≥80%) did not exceed a value of 0.10, and that similarly the beta error or the probability of mistakenly accepting an SD with unacceptable performance (≤50%) did not exceed 0.10.

