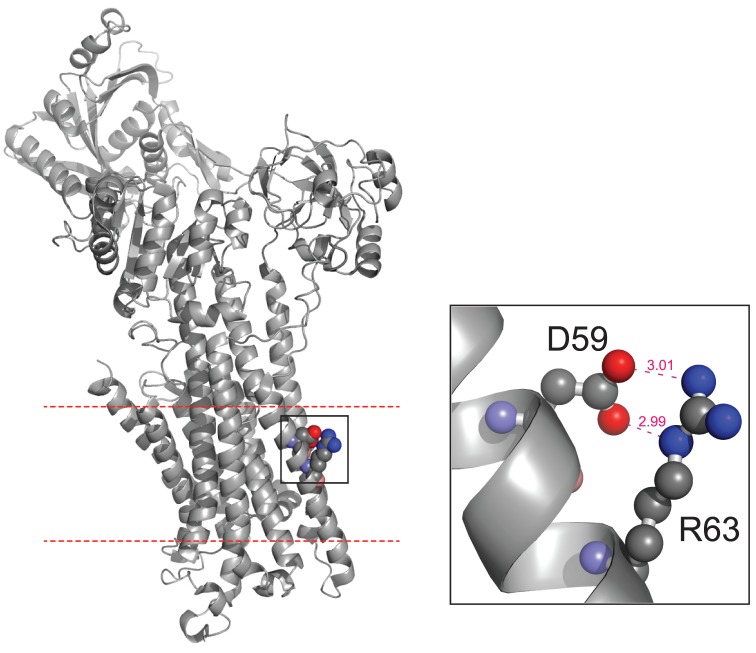
Figure 2. Structure of the calcium ATPase 1.
Left panel: cartoon representation of sarcoplasmic/endoplasmic reticulum calcium ATPase 1 (PDB ID: 1SU4) with cytosolic domain in the up side and transmembrane aspartic 59 and arginine 63 residues in spheres representation (C atom gray, O atom red and N atom blue). Membrane boundaries (dashed red lines) were obtained from the PPM Server [44]. Right panel: zoom view centered on the salt bridge between Asp59 and Arg63, dashed pink lines indicate O to N atom distances.

