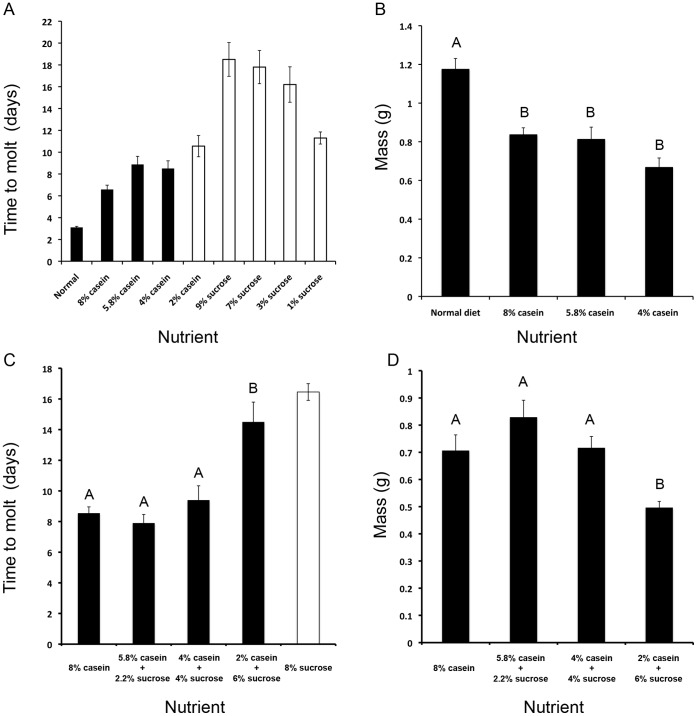
Figure 1. Effect of various nutrients on the survival and time to molt.
(A) Time to molt (black bars) or death (open bars) in 4th instar larvae fed various concentrations of casein or sucrose only diets (n = 8–12 for each treatment). (B) Final size at the time of the molt for larvae fed normal or casein-only diets. Different letters represent statistically significant differences (ANOVA with Tukey-Kramer HSD test; p<0.0001). The normal diet fed larvae were significantly larger than those fed 4% (p<0.0001), 5.8% (p = 0.0001) or 8% (p = 0.0001) casein only diets. The various casein diets did not produce significantly different effects on the final size at the time of molt (n = 8–12 for each treatment). Error bars represent standard errors. (C) Time to molt (black bars) or death (open bars) in 4th instar larvae fed casein diets supplemented with sucrose (n = 10–11 for each treatment). Different letters represent statistically significant differences (ANOVA with Tukey-Kramer HSD test; p<0.0001). Molting time of larvae fed a 2% casein diet supplemented with 6% sucrose was significantly delayed relative to the 8% casein only, 5.8% casein/2.2% sucrose and 4% casein/4% sucrose diets (p<0.0001, p<0.0001 and p = 0.001, respectively). (D) Final size at the time of the molt for larvae fed casein diets supplemented with sucrose. Different letters represent statistically significant differences (ANOVA with Tukey-Kramer HSD test; p = 0.0007). Larvae fed a 2% casein diet supplemented with 6% sucrose molted at a significantly smaller size relative to the 8% casein only, 5.8% casein/2.2% sucrose and 4% casein/4% sucrose diets (p = 0.0352, p = 0.0003 and p = 0.0247, respectively).

