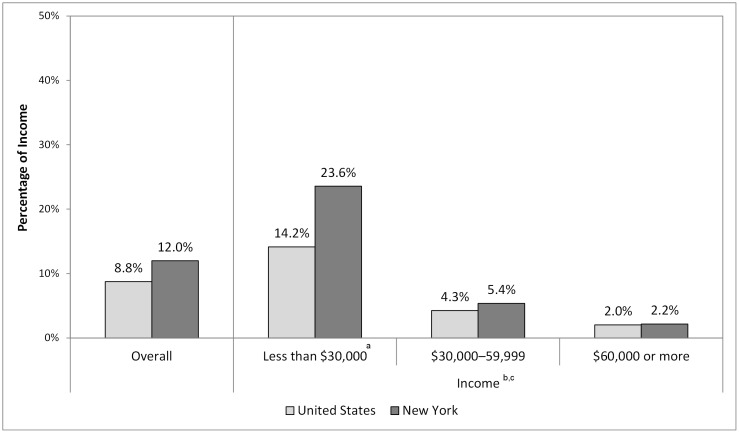
Figure 3. Percentage of Annual Household Income Spent on Cigarettes, Overall and by Income in New York and the United States, 2010–2011.
a Statistically significant difference between the percentage of income spent on cigarettes in New York between 2003–2004 and 2010–2011. b Statistically significant relationship between income level and the percentage of income spent on cigarettes in New York in 2003–2004. c Statistically significant relationship between income level and the percentage of income spent on cigarettes in New York in 2010–2011. This figure illustrates that smokers in New York earning less than $30,000 per year spend 21% of their income on cigarettes, compared to 2% for smokers earning $60,000 or more. The comparable percentages for smokers in the United States are 13% and 2% for those earning less than $30,000 and $60,000 or more respectively.

