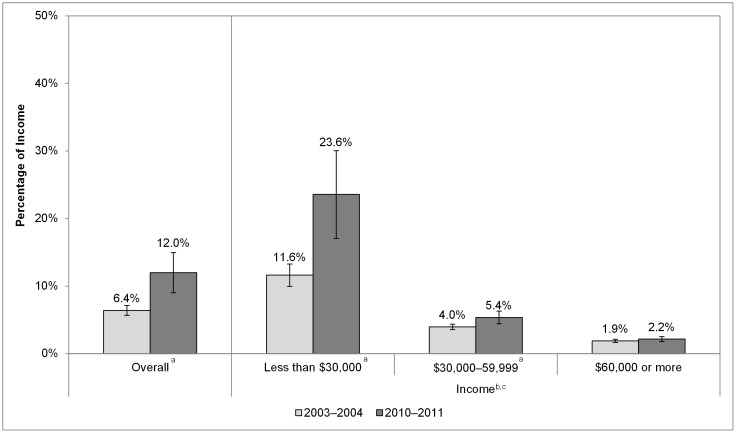
Figure 4. Percentage of Annual Household Income Spent on Cigarettes, Overall and by Income in New York, 2003–2004 to 2010–2011.
a Statistically significant difference between the percentage of income spent on cigarettes in 2003–2004 and 2010–2011. b Statistically significant downward trend in the percentage of income spent on cigarettes in 2003–2004 and 2010–2011. c Statistically significant difference between the downward trend in the percentage of income spent on cigarettes in New York and the United States. Between 2003–2004 and 2010–2011, the percentage of smokers incomes spent on cigarettes increased from 6% to 11% overall and from 10% to 21% for smokers with incomes less than $30,000.

