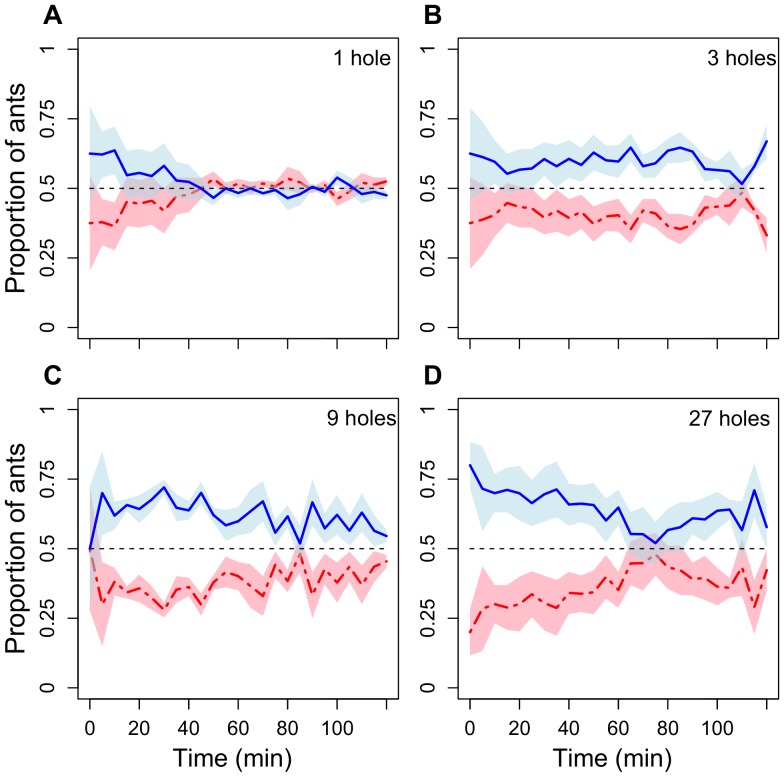
Figure 1. Proportions of ants visiting two identical 1 molar sucrose feeders each with 1, 3, 9 or 27 feeding holes (Experiment 1).
The blue line represents the feeder that had more ants after 5 minutes, the red line the other feeder. The dashed black line indicates an equal distribution of ants at both feeders. Data represent the mean of 6 test colonies, 1 trial per colony for each number of holes. The shaded areas (light blue and pink) represent the standard errors (SE) of the mean.

