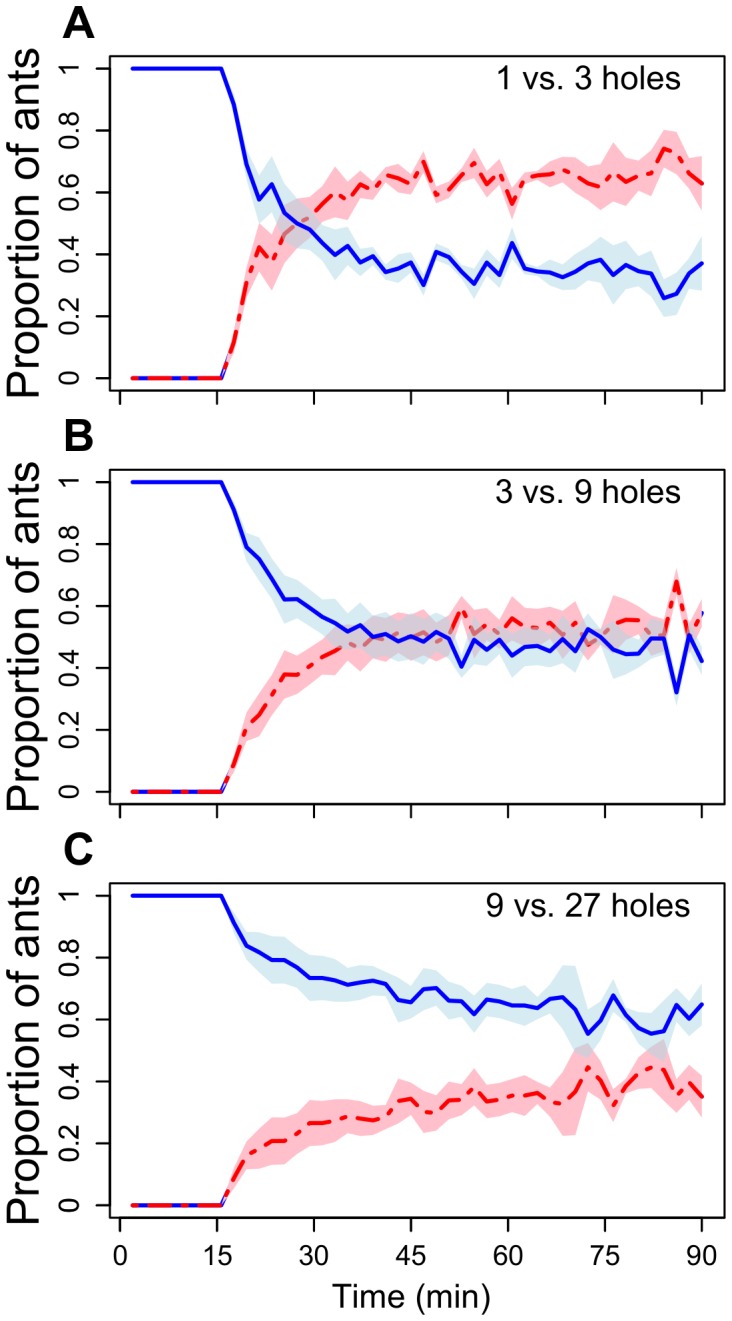
Figure 3. The mean proportion of ants at the two feeders, in which the second feeder (red line) had three times as many feeding holes but was made available 15 minutes after ants starting collecting syrup at the first feeder (blue line) (Experiment 2).

As can be seen, the lines cross for the 1 versus 3 hole situation, but not for 9 versus 27. The shaded areas represent the SE of the mean.
