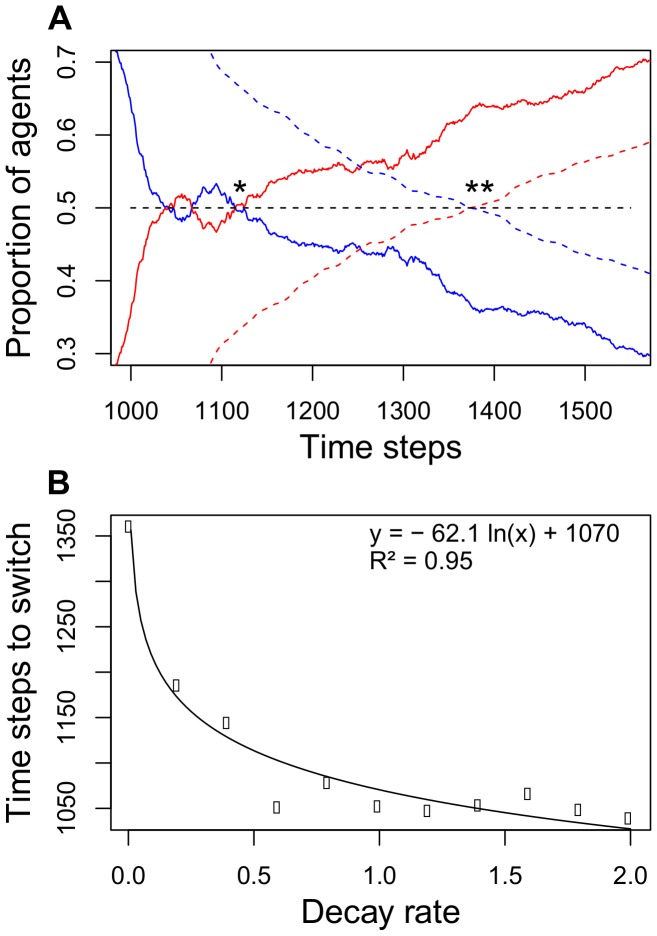
Figure 6. The number of agents on both branches and the time colonies needed to switch.
(A) Switch point of agents (solid lines, *) and pheromone trail strength (dashed lines, **). The solid lines show the proportion of ants foraging at the first (blue) and second patch (red). The second patch was available after a 900 time step (15 minutes) delay, but allowed 3 times more agents to collect food simultaneously (8 vs. 24 agents). The dashed lines show the relative amounts of pheromone on the branches leading to the first (blue) and second patch (red). The pheromone switch happened some time after the switch in the number of foraging ants (average of 30 simulations). (B) Relationship between the pheromone decay rate and the time until more agents foraged at the second food patch. Note that the switch happens even with a pheromone decay rate of zero. A decay rate of 2.0 corresponds to a pheromone decay below the perception threshold of the agents in less than 10 minutes.

