
Figure 3. TSPO expression of the control and LPS-induced lungs by Western blot assay.
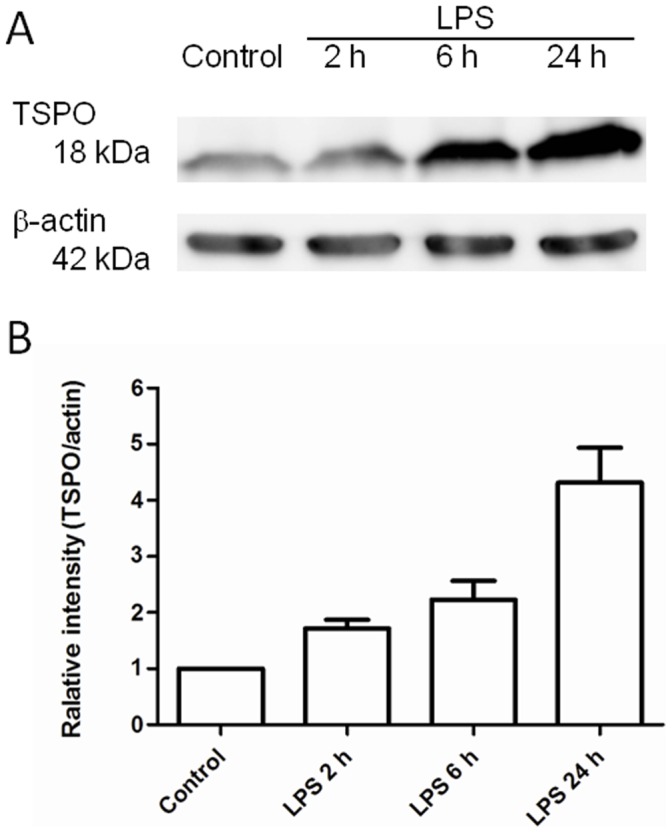
(A) Expression of TSPO and b-actin in lungs. (B) Relative levels of TSPO in the lung sections (n = 4 for each group). The relative intensity of LPS-2 h, 6 h and 24 h vs. control was compared using each corrected band intensity (TSPO/beta-actin). A low level of TSPO was noted on the band of the control lung. Increase in the TSPO expression was observed over time after LPS inducement. The relative intensities on the bands of LPS-2 h, 6 h, and 24 h, showing a stepwise increase of TSPO expression compared to the control band.