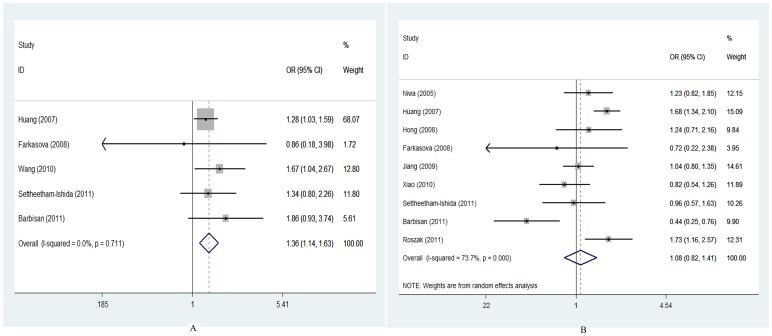
Figure 2. Forest plots of ORs with 95% CI for XRCC1 polymorphisms(Arg194Trp, Arg399Gln) and risk for cervical cancer.
The center of each square represents the OR, the area of the square is the number of sample and thus the weight used in the meta-analysis, and the horizontal line indicates the 95%CI. (A) Arg194Trp, Trp/Trp+Trp/Arg vs. Arg/Arg. (B) Arg399Gln, Gln/Gln+Gln/Arg vs. Arg/Arg.

