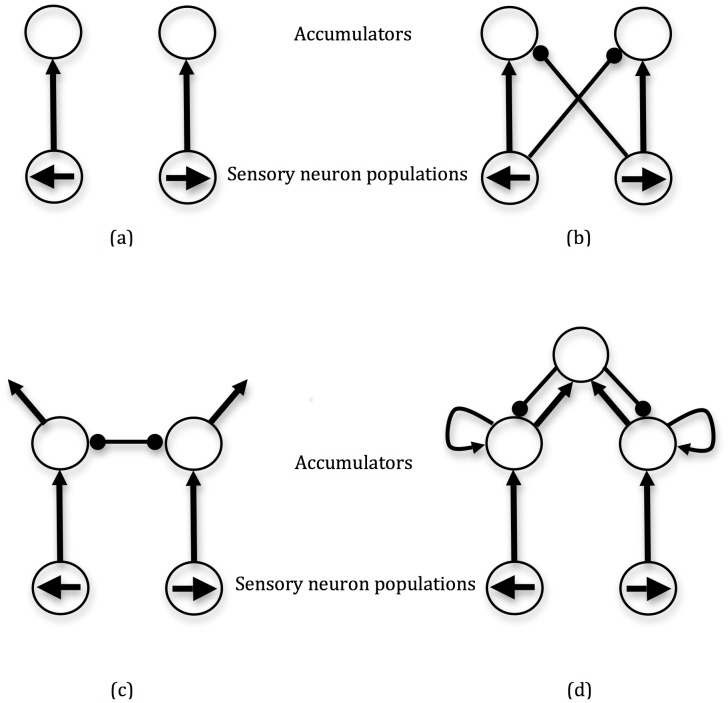
Figure 1. Accumulator models of decision-making.
Sensory neuron populations for each decision alternative feed into corresponding accumulators, which must reach a threshold for an appropriate action to be initiated. Lines with arrows denote excitatory inputs, while circles denote inhibitory inputs. Arrowed lines with no target denote activation leakage from populations. (a) race model [14]. (b) feed-forward inhibition model [22]. (c) mutual inhibition model [5]. (d) pooled inhibition model [17].

