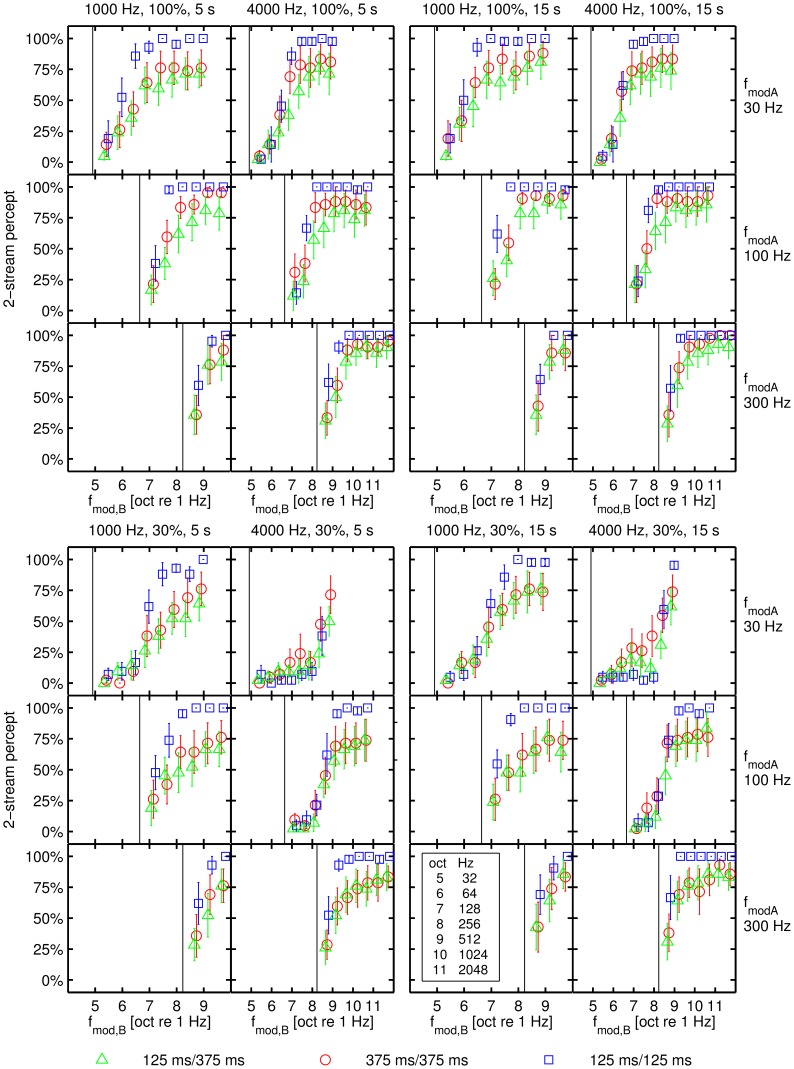
Figure 1. The percentage of a 2-stream percept in relation to the modulation frequency of the B SAM tone.
The percentage of a 2-stream percept depicted in relation to the modulation frequency of the B SAM tone in octaves (with reference to 1 Hz). Each of the four blocks represent data for a specific modulation depth (%) and presentation time (s). The two columns within each block represent data for different carrier frequencies (Hz). A vertical black line indicates the position of the reference modulation frequency fmodA, which is also indicated on the right hand side of each row of panels. The error bars denote the standard error and the coloured symbols indicate data obtained for the three different tone patterns (shortly denoted as TD/SOAacross).

