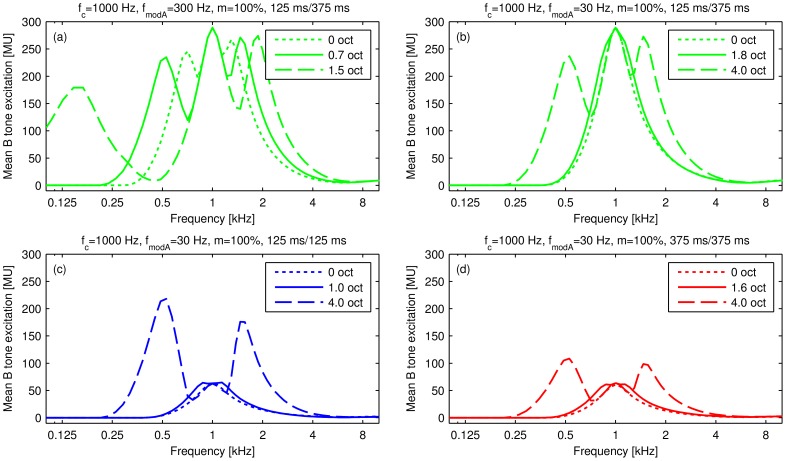
Figure 4. Modelled spectral excitation patterns for selected conditions.
Modelled spectral excitation patterns in arbitrary “model units” (MU) for selected conditions (parameters given in the panel titles). Each panel shows, for the respective condition, one excitation pattern (dotted line) at the reference modulation frequency (fmodA), one excitation pattern (solid line) at the 50% threshold of 2-stream responses calculated from the measured data (values given in the legends) and one excitation pattern at the maximal octave separation measured (dashed line). The excitation patterns reflect the mean model activation during presentation of the B tone excluding the silent gaps occurring in some of the conditions. The different colours indicate the tone pattern (shortly denoted as TD/SOAacross) as in the other figures.

