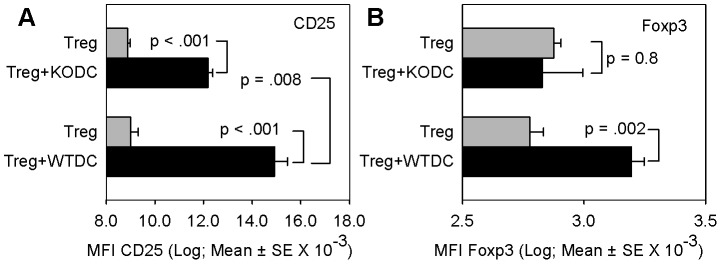
Figure 7. Dendritic cell IL-2 increases Treg phenotype.
DO11.10 CD4+CD25+ Treg cells were cultured without or with BMDCs from either WT or IL-2−/− KO (on B6 background) mice in transwells and the level of CD25 (A) and Foxp3 (B) on Treg cells was measured by flow cytometry as in materials and methods. A: Bars are the mean ± SE of mean fluorescent intensity (MFI) of CD25 levels on Thy1.2-gated Tregs of triplicate samples from one of four representative experiments. Statistical analysis was by Tukey's test for all pairwise comparisons. B: Bars are the mean ± SE of mean fluorescent intensity (MFI) of Foxp3 levels on Thy1.2-gated Tregs of triplicate samples from a single experiment. Statistical analysis was by Tukey's test for all pairwise comparisons.

