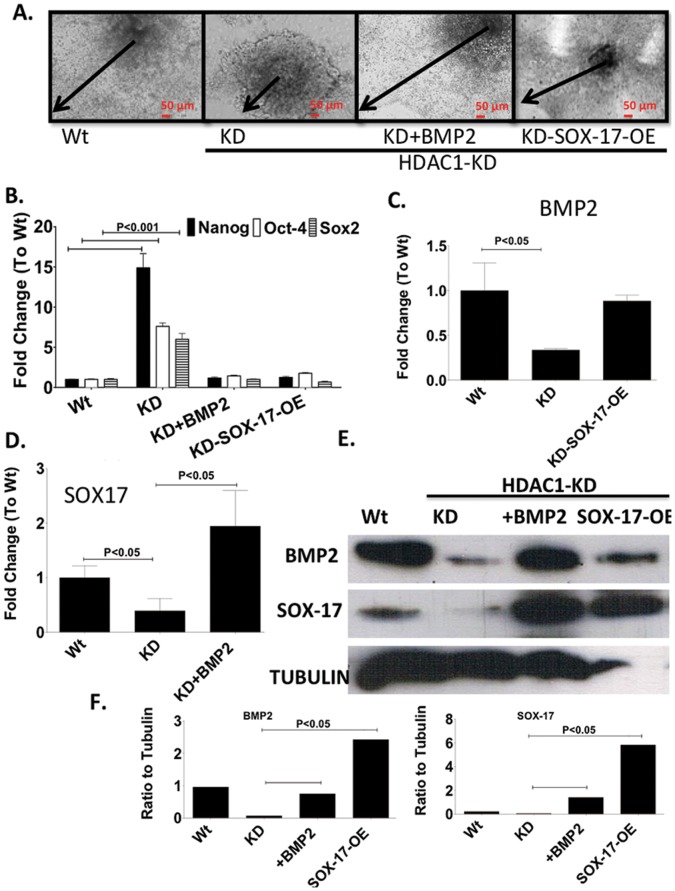
Figure 2. Sox-17 or BMP2 fully rescue HDAC1 phenotype. A.
Light microscopy images showing lack of differentiation in EBs derived from mES, mES-HDAC1-KD and mES-HDAC1-KD overexpressing Sox-17 or treated with BMP2 for two days, at day 6 of differentiation. Black arrows indicates distance from the center of the EB to the periphery. B. RT-PCR showing expression levels of Sox-2, Oct4 and Nanog on day 6 of differentiation in Wt mES cells mES-HDAC1-KD cells and mES cells lacking HDAC1 over expressing Sox-17 or treated with BMP2 for two days. C. RT-PCR showing expression levels of BMP2 in wt mES cells mES-HDAC1-KD cells and mES cells lacking HDAC1 over espressing Sox-17. D. RT-PCR showing expression levels of Sox-17 in Wt mES cells mES-HDAC1-KD cells and mES cells lacking HDAC1 over treated with BMP2 for two days. E. Western Blot of SOX-17 and BMP2 in Wt mES cells mES-HDAC1-KD cells and mES cells lacking HDAC1 over expressing Sox-17 or treated with BMP2 for two days. Band intensity was quantified using ImageJ. Data in all panels are represented as mean +/− SD and n = 3.

