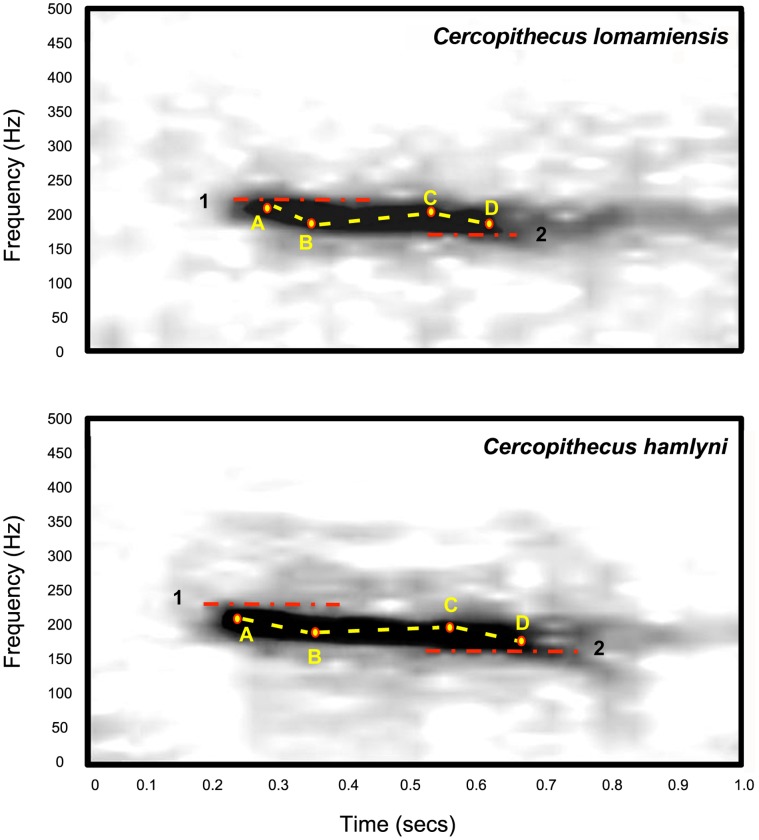
Figure 8. Spectrograms of booms of C. lomamiensis and C. hamlyni.
Frequency (Hz) is on the Y-axis; time (sec) is on the X-axis. Mean values for acoustic measures for each species are indicated: 1. High frequency, 2. Low frequency, A. Start frequency, B. Q1 frequency, C. Q3 frequency, D. End frequency, dotted line: slopes.

