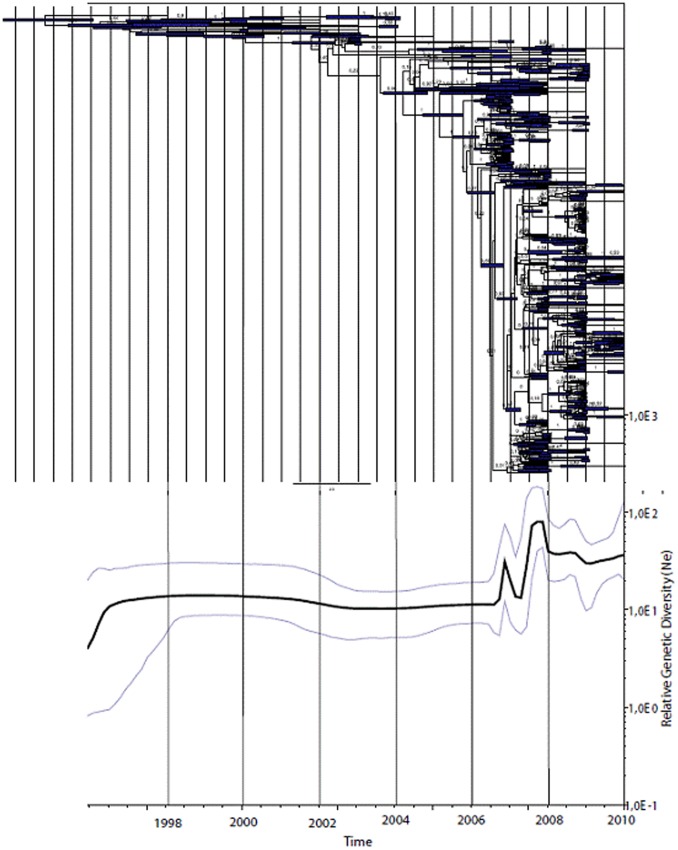
Figure 3. Maximum Clade Credibility tree and Bayesian Skyline of the China EV71 C4 strains.
The upper portion of the figure was maximum clade credibility tree with 95% highest posterior density (HPD) intervals for the node times (in years) and posterior probabilities for branching events. Tree was generated by the MCMC method in BEAST on the basis of a multiple alignment of VP1 nucleotide sequences of EV71 C4 strains collected in Guangdong Province from 2008 to 2010 and Genbank EV71 C4 reference strains isolated in mainland China from 1998 to 2010. Below the tree, the Bayesian Skyline with 95% HPD intervals shows the relative measure for genetic diversity through time (values plotted on y-axis).

