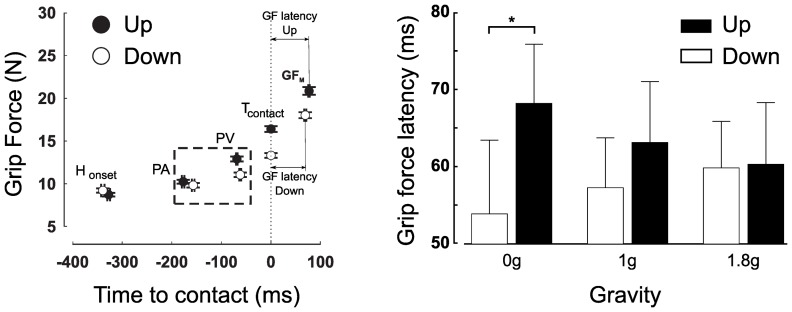
Figure 3. Grip force adjustment over time.
(Left) Grip force in function of time to contact in upward (closed disks) and downward (open disks) movements in 0 g. The means and SE of grip forces are reported for the following occurrences: hand onset (Honset), peak acceleration (PA), peak velocity (PV), time of contact (Tcontact) and grip force maximum (GFM). The horizontal SEs quantify the variability in the occurrences of these events. The vertical dotted line is positioned at contact. (Right) Delay between peak grip forces and contact in upward (black bars) and downward (open bars) trials in 0 g, 1 g and 1.8 g. All values are positive which means that peak grip forces lag the collision. Error bars are between participants SD. Asterisk denotes significant difference (p<0.05).

