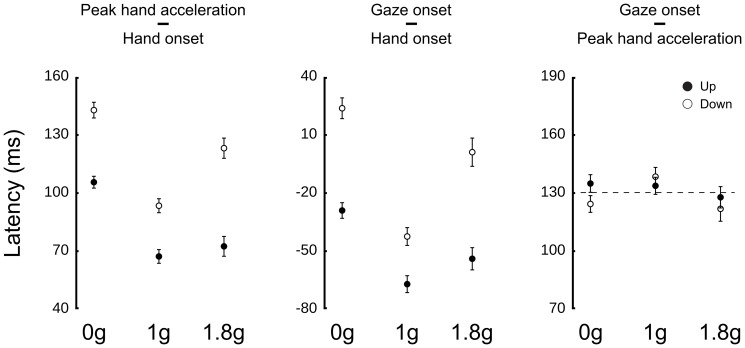
Figure 5. Constant latency across direction and gravitational conditions between times of peak hand acceleration and gaze saccade onset to the target.
Relative latencies between peak hand acceleration and hand onset (left panel), gaze onset and hand onset (middle panel) and between gaze onset and peak hand acceleration (right panel) in the three gravity fields. Open and closed disks denote downward and upward trials, respectively. Error bars represent between participants SE. The horizontal dashed line in the right panel is positioned at mean latency (132.6 ms).

