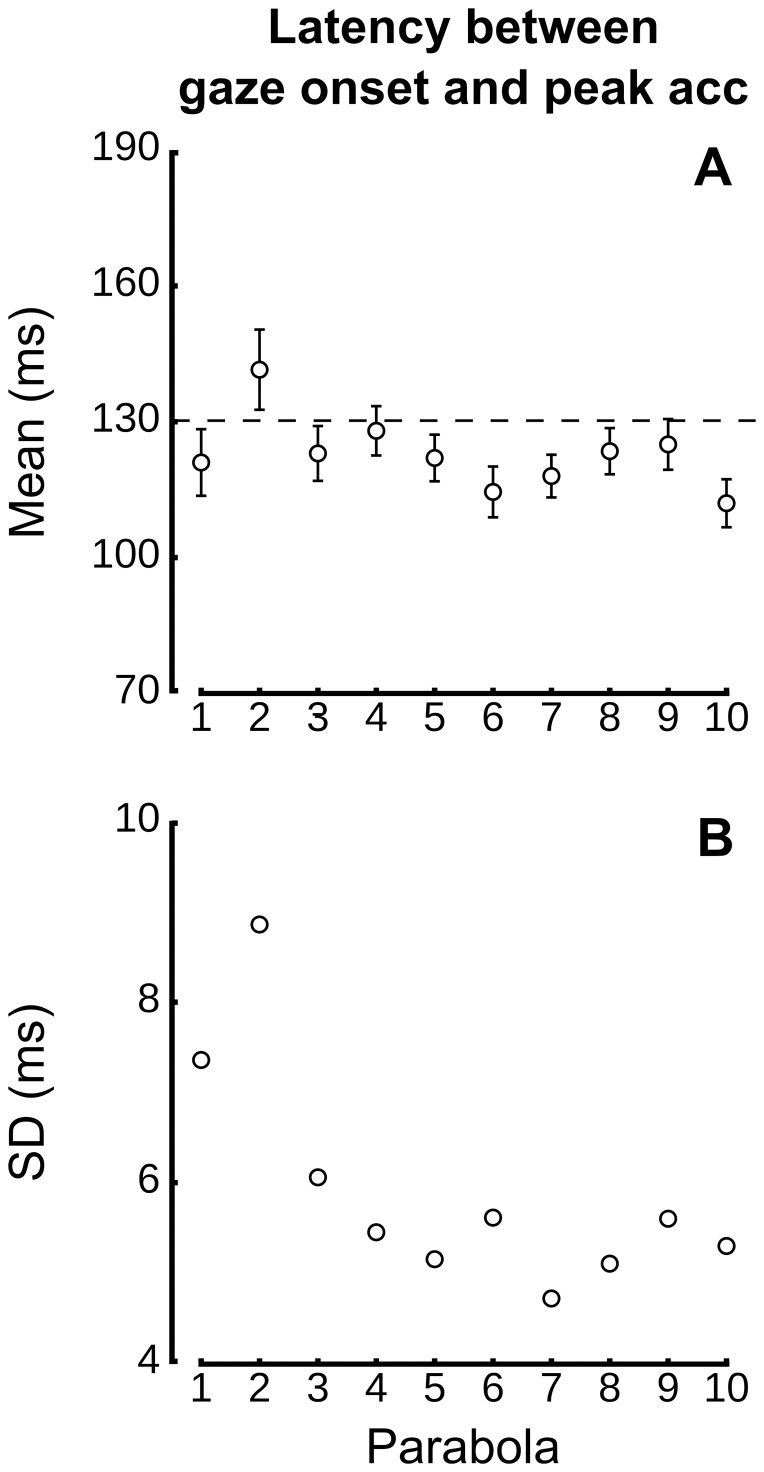
Figure 6. Decrease of variability of latency between times of peak hand acceleration and gaze saccade onset to the target across parabolas.
Mean gaze latencies relative to peak hand acceleration (A) and standard deviations of mean latencies (B) across the 10 parabolas. The horizontal dashed line in the top panel is positioned at mean latency (132.6 ms). Panel B reports a strong decrease in variability within three parabolas.

