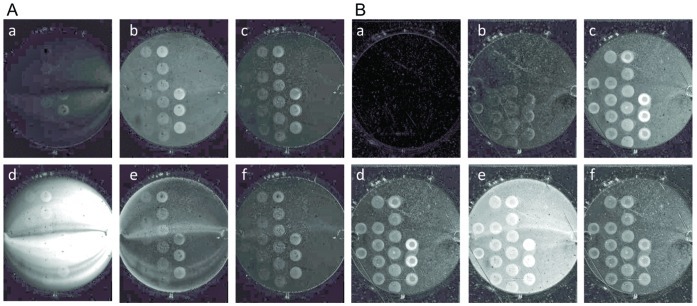
Figure 1. SPRi difference images of PFV-1 IN interacting with the biochip surface.
ssDNA solutions at 50, 25, 10, 6, 3, 1, 0.5 and 0.1 µM were spotted in replicates on the pre-treated surface. The entire spot image was between 0.8 and 0.9 cm in diameter and each individual spot was between 400 and 450 µm in diameter. The spotting, of decreasing ssDNA concentration, starts from left to right, and downward. A: ssDNA spotted on EG4 pre-treated surfaces, PFV-1 IN at 200 nM was flowed across the SPRi surfaces containing the spotted ssDNA molecules. Difference images during the injection are shown in panels a and b, while panel c is a difference image after the injection of the protein was stopped. Panel d and e shows difference images during the injection of a solution of 0.1% SDS across the surface during the dissociation phase of PFV-1 IN. Panel f shows difference images of PFV-1 IN retained at the surface after the SDS injection. B: Surfaces were prepared as previously by spotting ssDNA at various concentrations on the pre-treated surface. Then the complementary ssDNA oligomers was flowed across the surface in order to hybridize and form dsDNA before injecting PFV-1 IN at 200 nM across the SPRi surface. Panels a to c are difference images of PFV-1 IN flowing across the SPRi surface and panel d is a difference image after the injection of the protein was stopped. Panel e and f are difference images during and after the injection of a 0.1% SDS solution.

