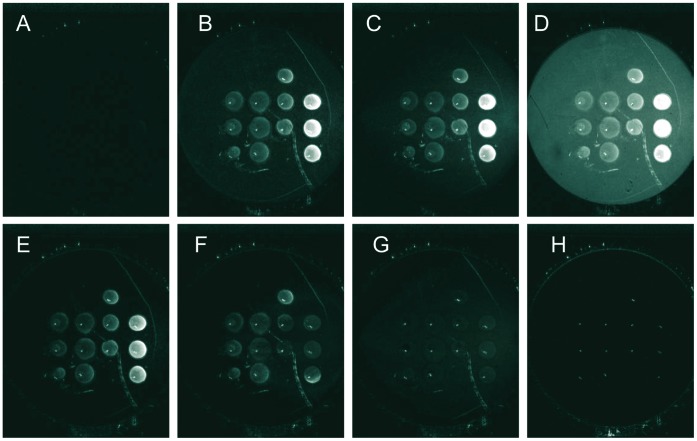
Figure 4. SPRi difference images of the biochip surface at different times during the course of the experiment.
The EG4 adsorption time was 30 s. 4 different SH-5T-dsDNA solution concentrations were spotted in rows from right to left: 10, 5, 2.5 and 1 µM respectively. Each SH-5T-dsDNA concentration was spotted 3 times in the same column. A: t = 0 s, no PFV-1 IN protein injected. B, C, and D are images taken at t = 18 s, t = 3 min and t = 5 min respectively after 200 nM PFV-1 IN injection. E is the image taken 12 min after the injection was stopped. F, G and H are images taken at t = 9 s, t = 2 min, t = 6 min and t = 10 min after the start of the 0.1% SDS injection.

