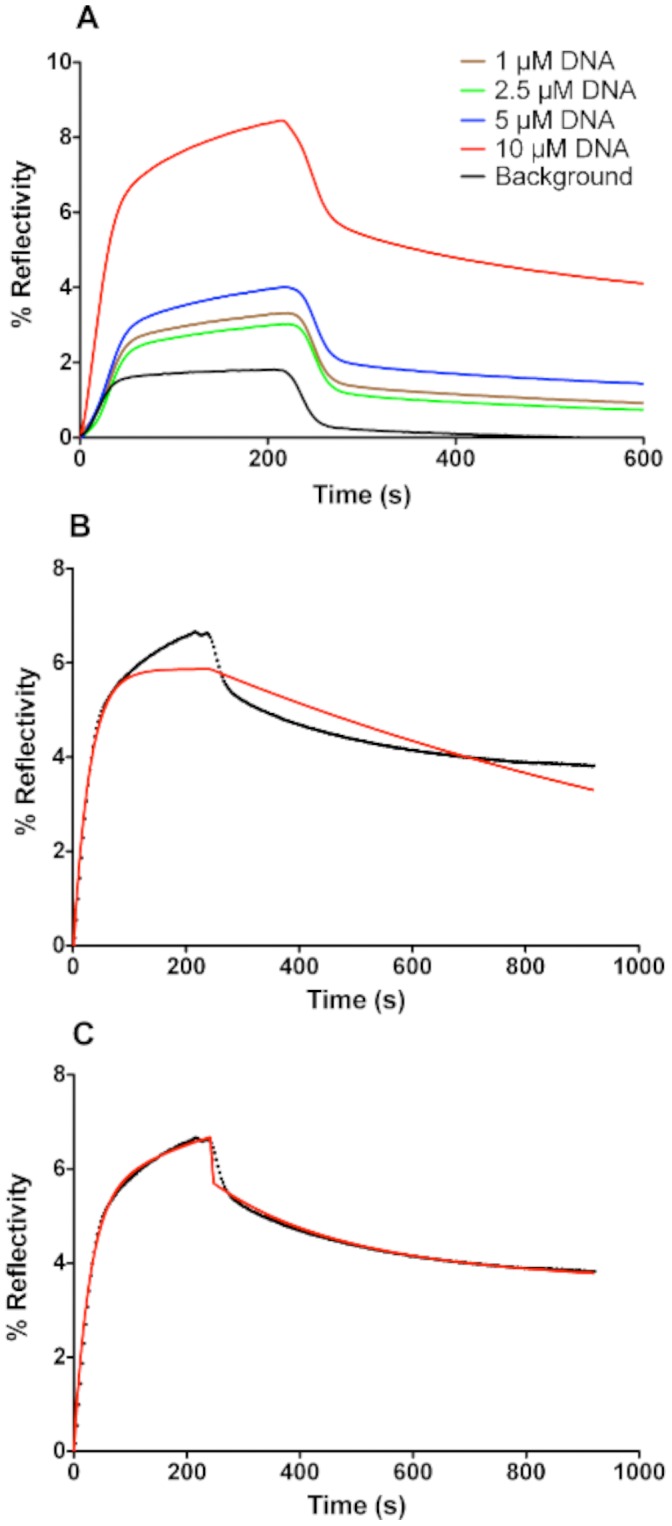
Figure 5. SPRi kinetic curves of PFV-1 IN (200 nM) interacting with immobilized dsDNA on the pre-treated surface.

The values for % reflectivity were obtained from direct CCD camera measurements averaged across each spot shown in Figure 5 and as described in [27]. A: Changes in % reflectivity at selected spots on the SPRi surface as a function of time as PFV-1 IN passes over the prism surface. The curves show binding to spots containing different concentrations of DNA (1, 2.5, 5 and 10 µM) or to reference spots (containing no DNA) outside of the zone to which DNA was applied (designated as background). B: The kinetic curve after subtraction of the background for reaction taking place on a spot where 10 µM DNA solution was deposited. The red line is a fit carried out by applying a single exponential model  where
where  is the % reflectivity at time t;
  is the amplitude of the phase, and the observed rate constant
  ,
,  is the association rate constant,
  is the dissociation rate constant calculated from a simple exponential fit of the dissociation phase using
  and [C] is the concentration of PFV-1 IN (200 nM). C: same curve as shown in B but fitted (red line) with a double exponential model for both association and dissociation. The model for association is
  and dissociation is obtained from
  where
where  is the % reflectivity at time t; and
  and
and  are the respective dissociation rate constants for the two phases
  and
and  ;
;  and
and  .
.
