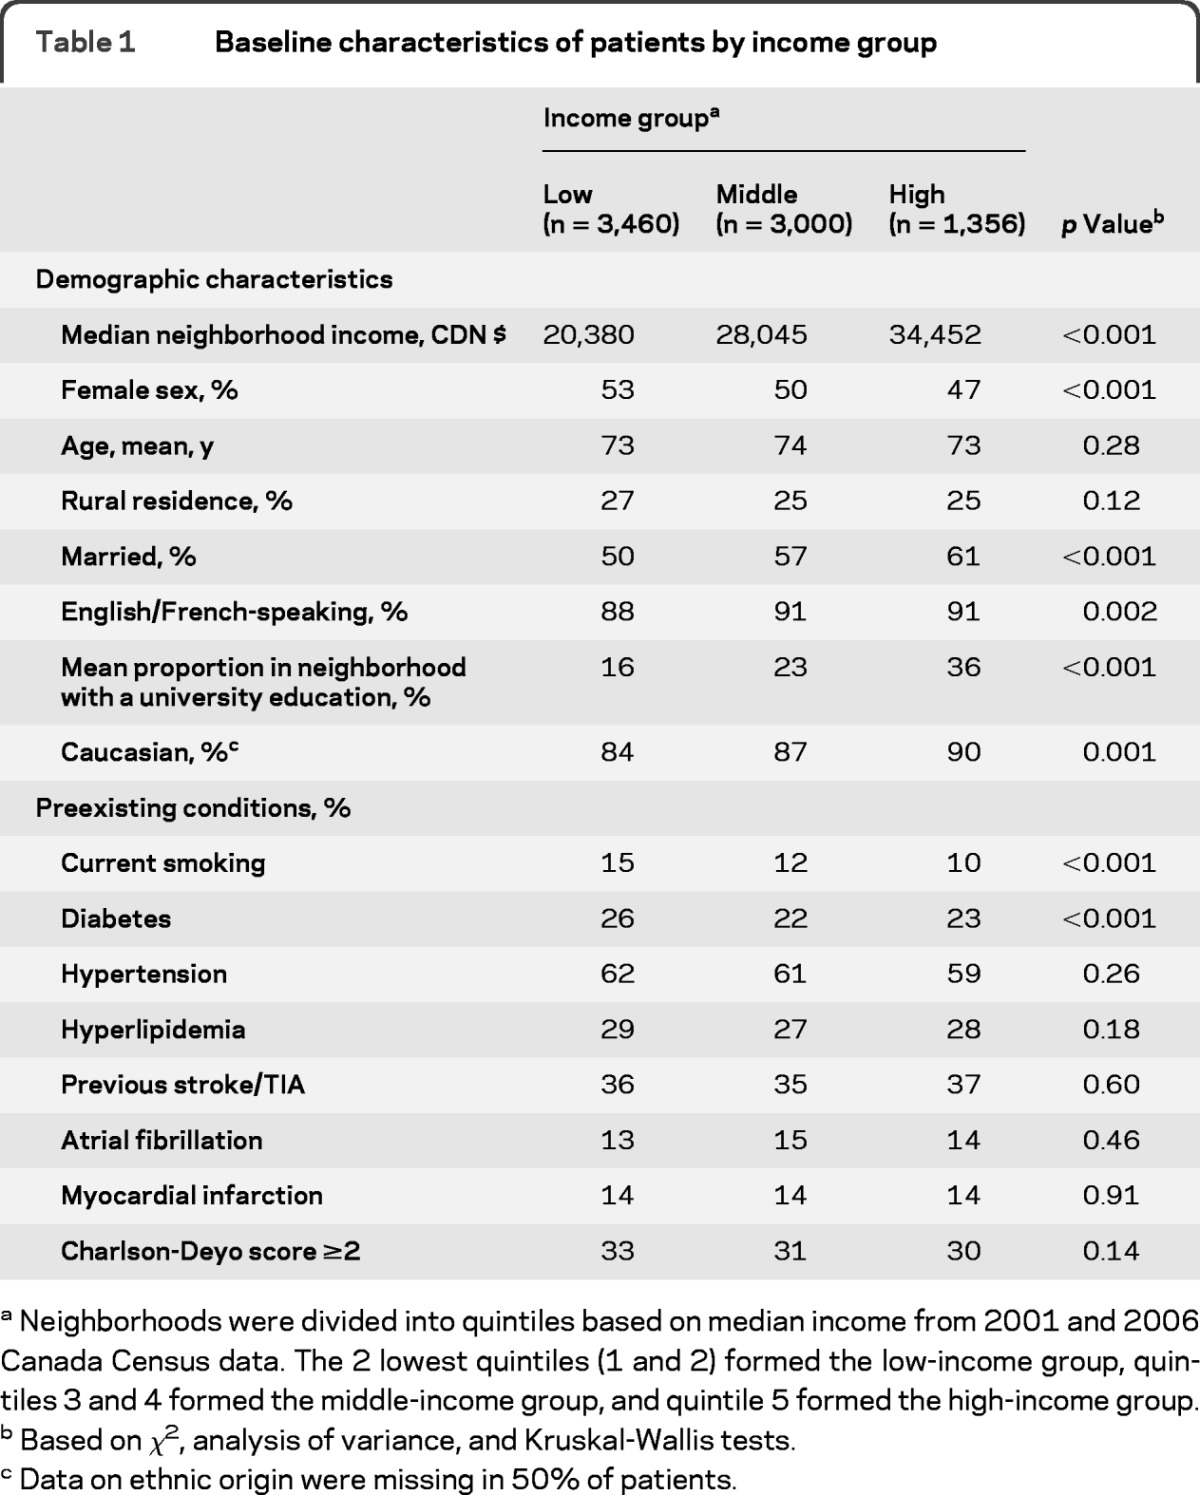
Table 1.
Baseline characteristics of patients by income group

Neighborhoods were divided into quintiles based on median income from 2001 and 2006 Canada Census data. The 2 lowest quintiles (1 and 2) formed the low-income group, quintiles 3 and 4 formed the middle-income group, and quintile 5 formed the high-income group.
Based on χ2, analysis of variance, and Kruskal-Wallis tests.
Data on ethnic origin were missing in 50% of patients.
