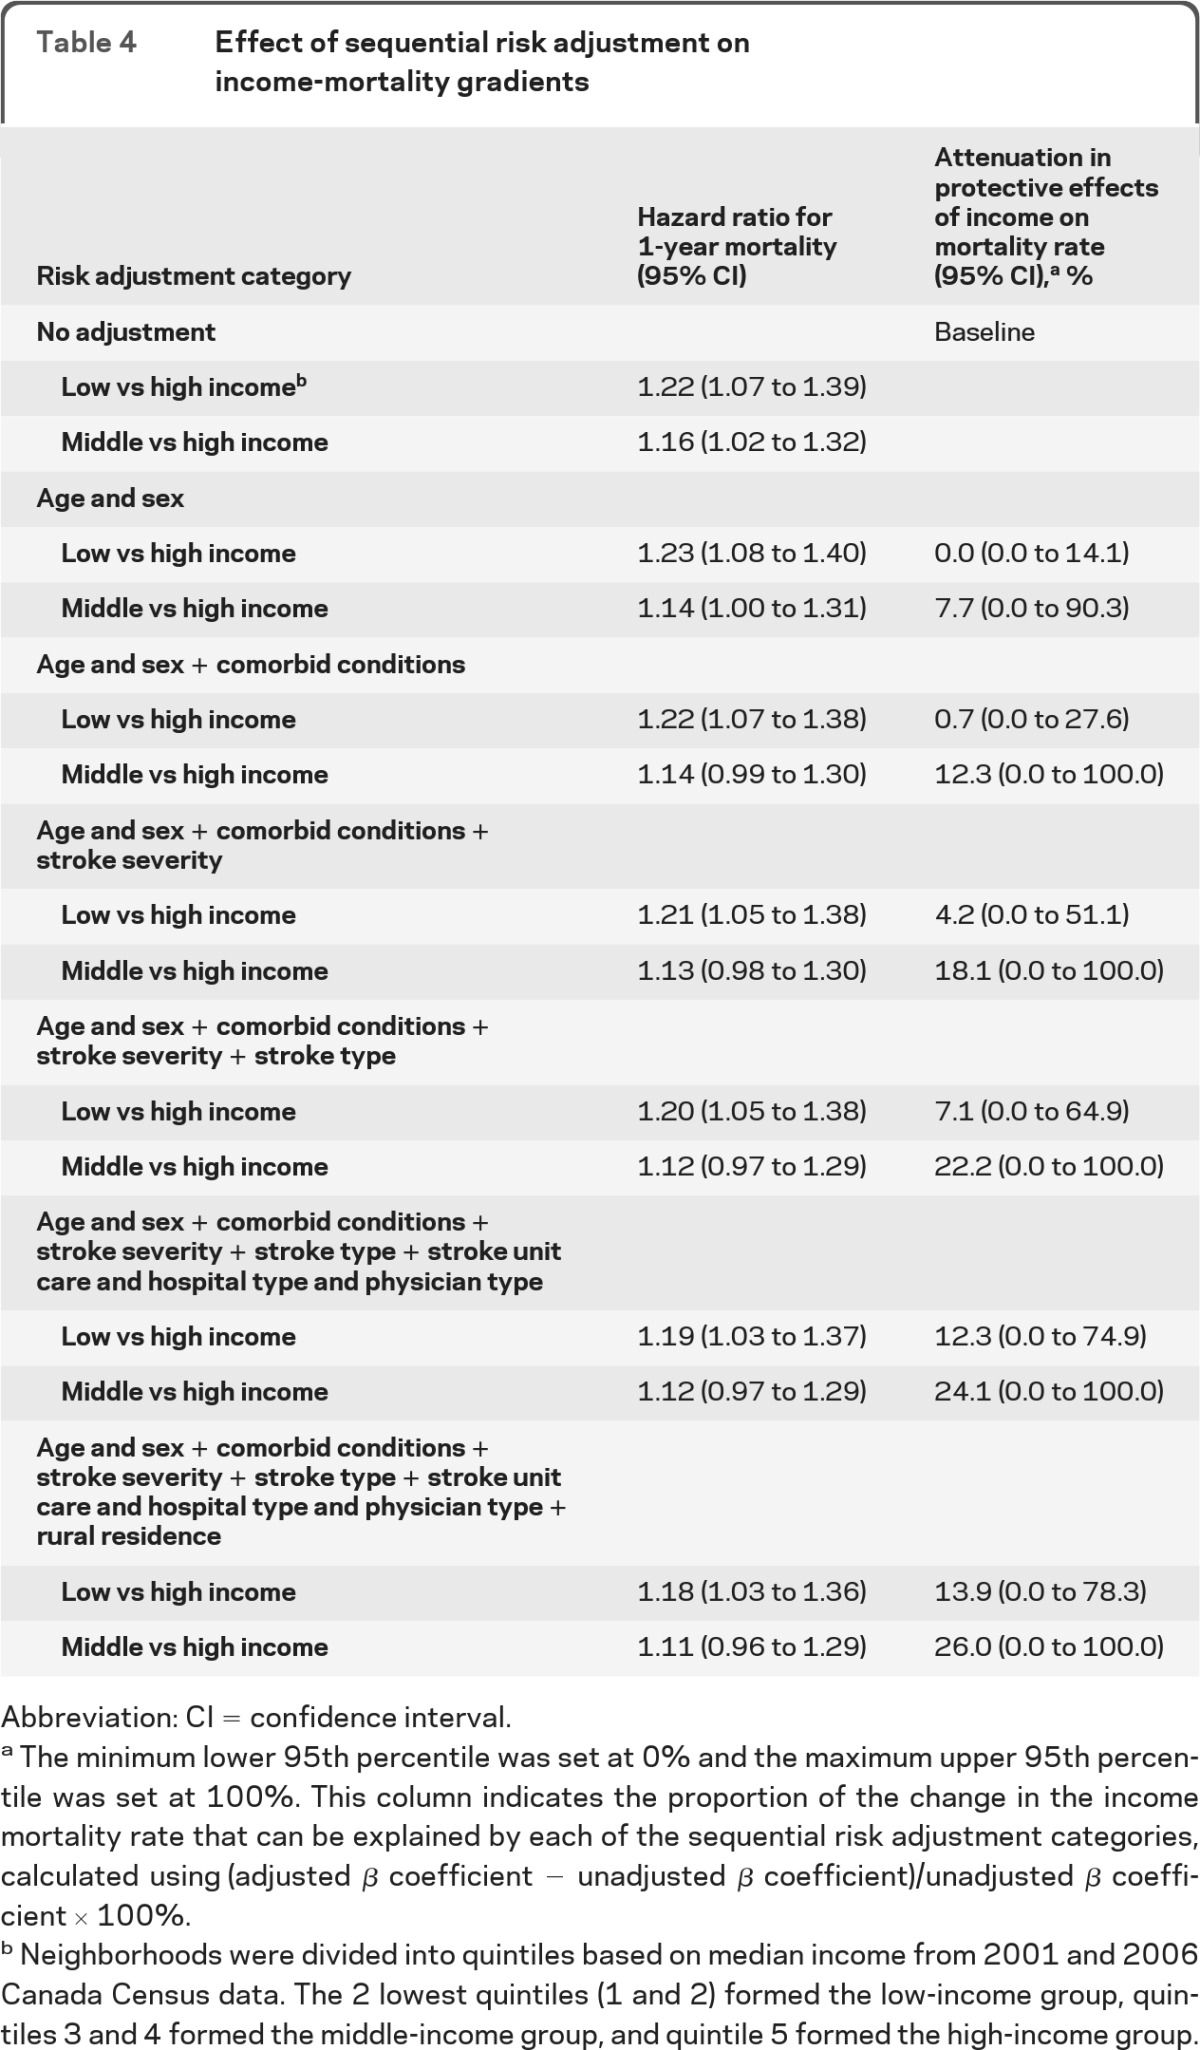
Table 4.
Effect of sequential risk adjustment on income-mortality gradients

Abbreviation: CI = confidence interval.
The minimum lower 95th percentile was set at 0% and the maximum upper 95th percentile was set at 100%. This column indicates the proportion of the change in the income mortality rate that can be explained by each of the sequential risk adjustment categories, calculated using (adjusted β coefficient − unadjusted β coefficient)/unadjusted β coefficient × 100%.
Neighborhoods were divided into quintiles based on median income from 2001 and 2006 Canada Census data. The 2 lowest quintiles (1 and 2) formed the low-income group, quintiles 3 and 4 formed the middle-income group, and quintile 5 formed the high-income group.
