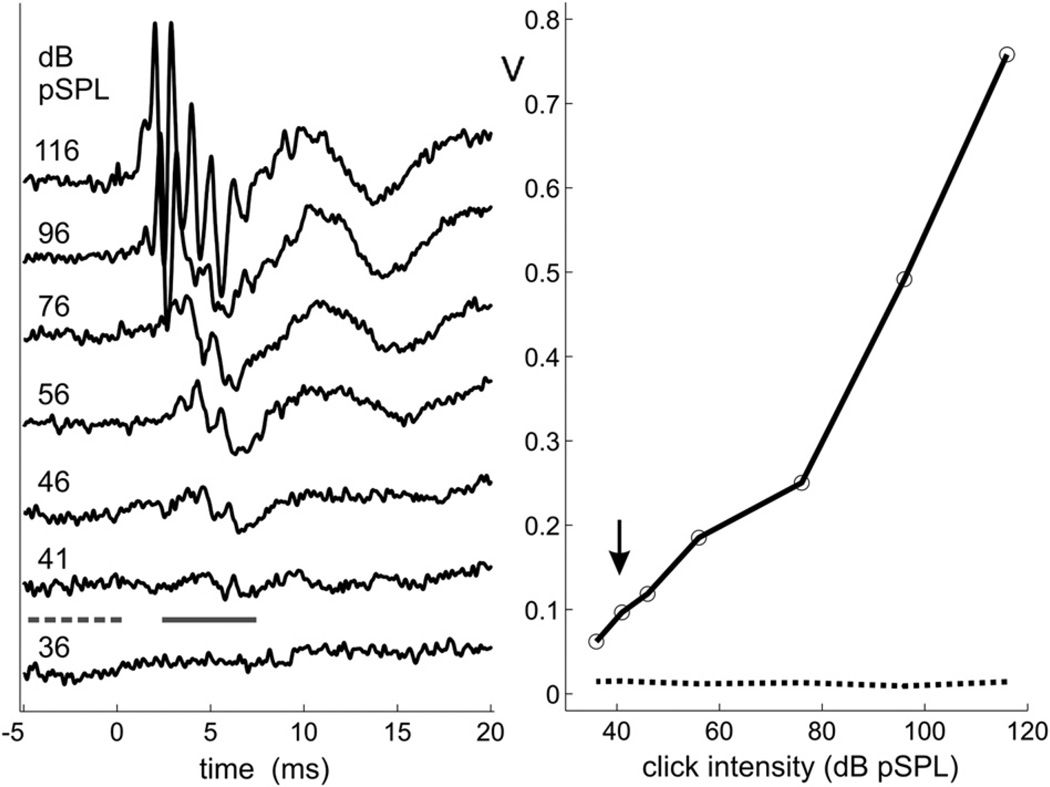
Fig. 1.
Left panel: ABR recording series for the implanted right ear of animal M5 in response to acoustic clicks. Each trace is the average of 500 stimulus presentations. Solid and dashed lines indicate time windows for analyzing waveform amplitude and noise level, respectively. Right panel: Waveform amplitude (solid line) and noise level (dotted line) in amplified voltage (V) as a function of stimulus level.

