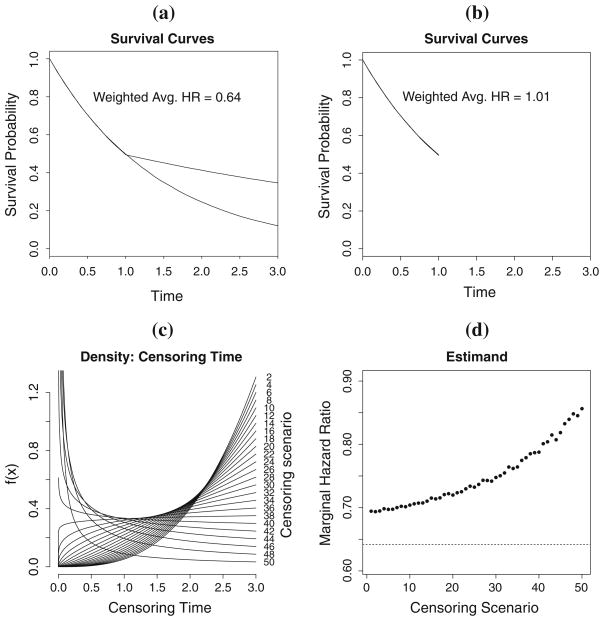
Fig. 2.
Illustration of the censoring-dependence and maximum observable time. a shows the survival curves for two groups exhibiting nonproportional hazards over the support [0,3]. b shows the survival curves for the same two groups over the support over [0,1]. c shows varying densities for the censoring times that correspond to different estimands in d

