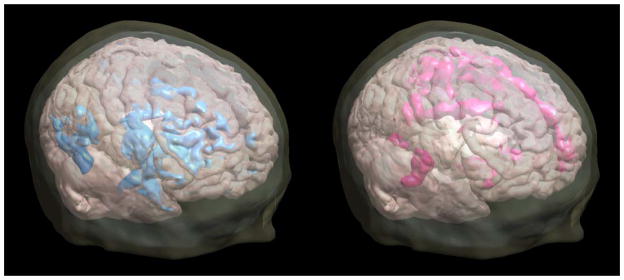
Figure 1.
Changes in cerebral glucose metabolism after acute citalopram administration (40mg, IV). In males (depicted on the left) the predominant change was a decrease in metabolism, and in females (depicted on the right) the predominant change was an increase in metabolism. The “blobs” indicate significant regions of change above the statistical threshold (p < 0.00288). Figures are superimposed on a three- dimensional rendering of a 7T MR scan.

