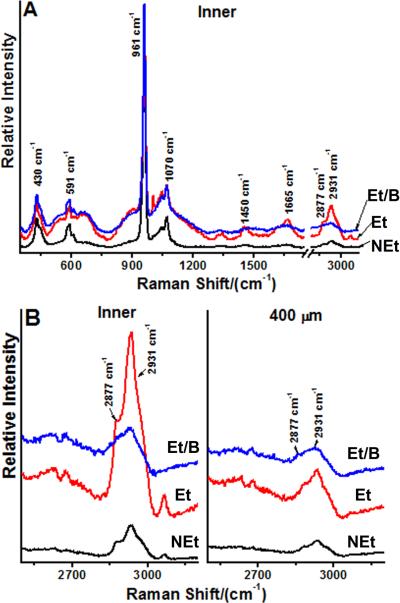
Fig. 4. Confocal Raman spectroscopic analysis of the enamel interphase matrix.
Data shown are representative of scans of sectioned teeth from four different individuals.
A, baseline corrected Raman spectra of enamel at a location 50 μm (Inner) from the dentin-enamel junction. Spectra were recorded before and after sequential etching and bleaching steps. Five separate scans were made at different sites for each condition and averaged to generate the spectra shown. A higher resolution view of the region of interest between 2500 and 3200 cm−1 is presented in B. KEY: NEt, non-etched; Et, etched; and, Et/B, etched and bleached.
B, baseline corrected Raman scans of a sectioned tooth at two different locations, near the dentin-enamel junction (Inner) and at least 400 μm away from the dentin-enamel junction (400 μm). Spectra were recorded at these locations before and after etching and bleaching steps. Five separate scans were made at each enamel location for each condition and averaged to generate the curves shown. KEY: Inner, enamel 50 μm from the dentin-enamel junction; 400 μm, enamel at least 400 μm away from the dentin-enamel junction; NEt, non-etched; Et, etched; and, Et/B, etched and bleached.

