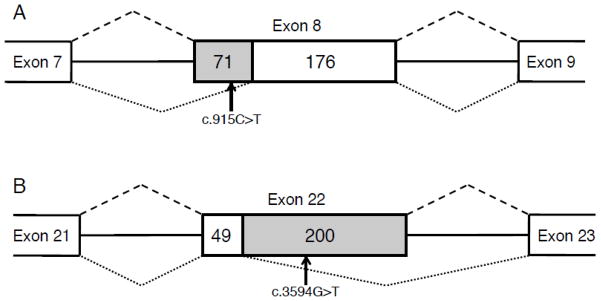
Figure 3.
Schematic representation of splicing aberrations introduced by variants 2 and 5. A) Exon 8, in which variant 2 is located, is fully spliced with the reference allele (splicing pattern shown above by dashed lines). When the variant “T” allele is present at exon position 46, a total of 71 bps are skipped from the 5′ end of the exon (splicing pattern shown below by dotted lines). B) In the case of variant 5 (c.3594G>T), 200 bps are skipped from the 3′ end of exon 22. Flanking exons and introns are not shown to scale, whereas the middle exon is shown to scale. Numbers indicate size in bps of each section. The skipped region is shown with shaded background.

