
Figure 1. Relative risk vs dose (with 95% CI) for various malignant endpoints, with fit of optimal linear and linear-exponential models. All use relevant average organ dose (stomach for all cancer, all other cancers).
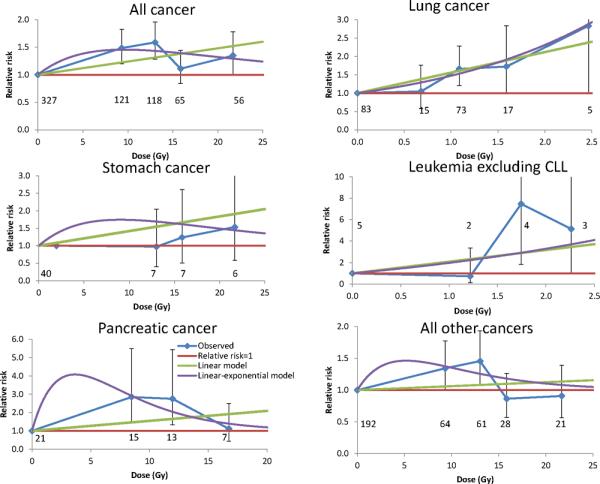
Background model is as for Tables 3, 5. Numbers of deaths in each dose group are shown.