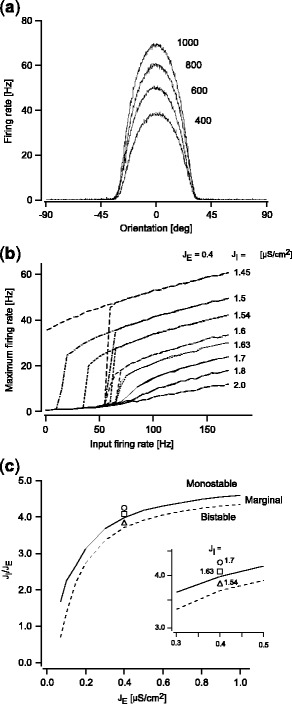
Fig. 3.

Spike firing patterns and synaptic weights. (a) Examples of spike firing patterns of the model with excitatory and inhibitory synaptic connections (J E = 0.4, J I = 1.7). The model was driven by the afferent input, whose maximum firing rate, F aff(t), was kept constant over time. The firing rate for each neuron was measured after the firing pattern became stable, and five trials for afferent inputs of the same amplitude but with independent Poisson spike sequences were averaged. Representative examples from four different amplitudes are shown. (b) Relationship between input and output spike firing rate of the model. The maximum firing rate in the model is plotted against the amplitude of the afferent input (five trials were averaged as in panel (a)). To evaluate stability and hysteresis of the model, the amplitude of the afferent input was gradually increased from a subthreshold to a suprathreshold regime, then decreased in the opposite direction. Results are shown for representative examples of synaptic weight sets. (c) A phase diagram of the model with respect to synaptic weights. The phase diagram is parameterized by the excitatory synaptic weight J E and the ratio of the inhibitory synaptic weight to the excitatory synaptic weight (J I/J E). The solid line and dashed line indicate the boundary between the monostable and marginal regime, and that between the marginal and the bistable regime, respectively. Markers indicate the representative synaptic weight sets used in the paper. The inset shows the area around the markers magnified
