
Fig. 5.
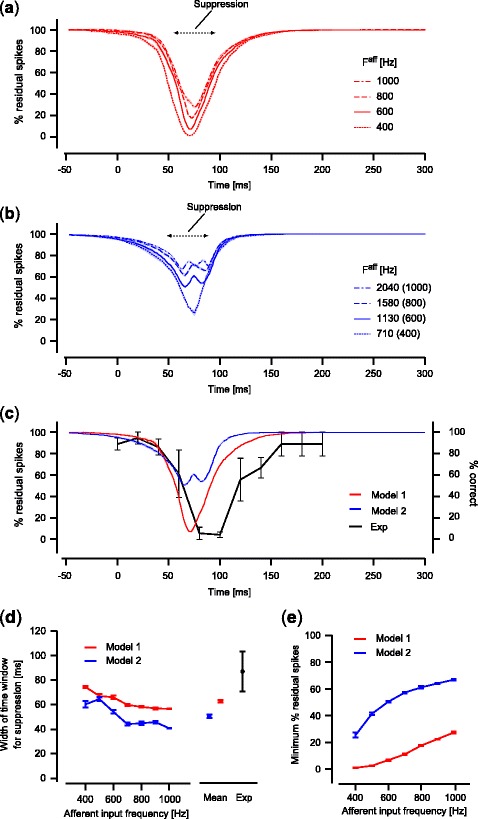
Relationship between magnitude of suppression and TMS application timing. (a) The magnitude of spike suppression induced by TMS for the synaptically-connected model (Model 1; monostable regime (J E = 0.4, J I = 1.7)). The horizontal axis corresponds to the TMS timing relative to the onset of the afferent input. Results show representative examples using the afferent input of four different amplitude values. Each line indicates a mean of five trials for each amplitude condition. Shaded areas around the lines indicate standard error. (b) The magnitude of spike suppression induced by TMS for the model without synaptic connections (Model 2; J E = J I = 0). Numbers in parentheses indicate the amplitude of the afferent input with which Model 1 produces a similar spike firing pattern. For example, the afferent input with F aff = 1130 Hz for Model 2 serves equivalently as the afferent input with F aff = 600 Hz for Model 1 in terms of observed spike firing patterns. (c) Comparisons of the magnitude of suppression between the models and the experiment. The experimental result of Amassian et al. (1989) is replotted as a black line, showing the percentage of correct responses for the letter identification task (right axis; mean of three subjects; error bars, standard error; data from Amassian et al. 1989). The percentage of residual spikes after TMS (left axis) is shown for Model 1 (red line) and Model 2 (blue line). Results of F aff = 600 Hz for Model 1 and F aff = 1130 Hz for Model 2 are shown as representative examples. (d) The width of the time window effective for suppression. Averaged values for five trials are plotted against the amplitude of the afferent input for Models 1 and 2 (red and blue lines, respectively; error bars, standard error). A total mean for tested amplitudes of the afferent inputs is also shown for each model to compare with the effective time window calculated from the experimental data of Amassian et al. (1989; black markers; mean of three subjects; error bars, standard error). (e) The minimum value of the normalized residual spikes count. Averaged values for five trials are plotted against the amplitude of the afferent input for Models 1 and 2 (red and blue lines, respectively; error bars, standard error). For panel (d) and (e), the amplitude of the afferent input for Model 2 was plotted as the value corresponding to that for Model 1