
Fig. 7.
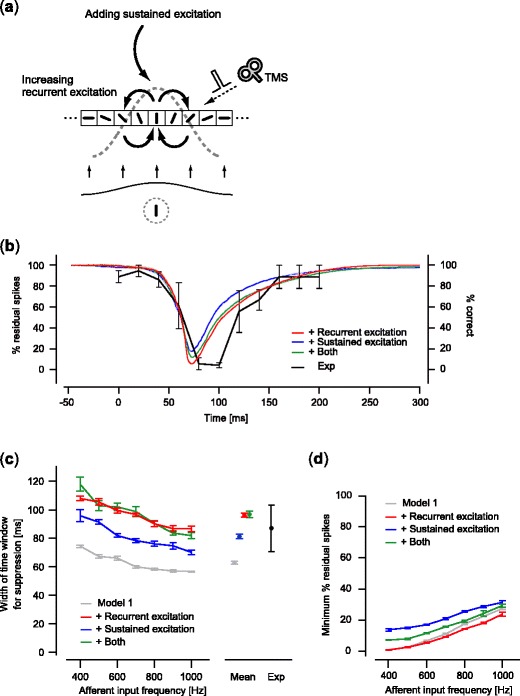
Relationship between magnitude of suppression and TMS timing for the models representing sustained neural activity. (a) Modified models representing sustained neural activity. Model 1 was modified by increasing the synaptic weight for recurrent excitation (Model 3–1), adding weak sustained excitatory input (Model 3–2), or applying both (Model 3–3). (b) The magnitude of suppression for the three models representing sustained neural activity. Results of F aff = 600 Hz were shown as representative examples for each model (mean of five trials; shaded area, standard error). Each of the colors corresponds to one of the three models. The experimental result (Amassian et al. 1989) is plotted as shown in Fig. 5(c). (c) The width of the time window effective for suppression. (d) The minimum value of the residual spikes. For panels (c) and (d), results are shown in the same way as in Fig. 5(d) and (e), respectively, for the three models and the experiment. Results of Model 1 are shown for comparison in panels (c) and (d)